Arches for Science Demo
Notes: The Arches for Science demo site will be refreshed on even-numbered calendar days at 5:00 AM GMT. Any data you enter into the system will be deleted.
While visiting the Arches for Science demo site, you will be automatically logged in to the “demo-user” account. This will ensure that you have the appropriate access to explore the site. If you encounter password-protected areas, these are for administrators only.
The Arches for Science demo site is based on Arches for Science, which is a customization of Arches for the management and sharing of heritage science data. The demonstration site highlights the enhancements made to core Arches in order to capture all data, including metadata and paradata, from scientific experimentation in the service of art historical research and art conservation treatments.
Arches for Science was created as a generic platform for the management and sharing of heritage science data, and like all Arches applications, is meant to be further customized and adapted to specific institutional use cases. Building on top of core Arches, Arches for Science includes the following features that have been configured specifically for heritage science data:
- Resource Models – Arches for Science includes resource models that aim to represent the breadth of heritage science data. Based on the Linked Art curation of the CIDOC Conceptual Reference Model, the following resource models are included: Physical Thing, Project, Collection or Set, Digital Resources, Person, Group, Instrument, Observation, Modification, Sampling Activity, Textual Work and Place.
- Workflows – In order to streamline data entry, Arches for Science features several data entry workflows that curate the data entry fields based on common tasks. To learn more, see the workflow tutorials below.
- Annotation of images – In Arches for Science, users can annotate images of objects to show areas of analysis and areas that have been sampled. To learn more, see the “Object Sampling Locations and Analysis Areas” tutorial below.
- Chart visualization of 2D instrument data – In Arches for Science, users can visualize and compare 2D data in an interactive chart. To learn more, see the the “Visualization of 2D Instrument data” tutorial below.
- IIIF Image Viewer and Comparison Tool – Arches for Science features a IIIF image server called the Image Service Manager in which users can create a new IIIF image manifest or access IIIF images services from external sources. In addition, the Image Service Manager also includes to ability to compare images using a slider function. To learn more, see the “IIIF Image Viewer and Comparison Tool” tutorial.
- Report Generation – Arches for Science can generate reports based on document templates that include the information and data selected. To learn more, see the “Manage Projects: Generate a Report” tutorial below.
Demo Data
The Arches for Science demo site currently contains two data sets:
- A small set of test data that was created by the Technical Studies Research unit of the Getty Conservation Institute Science department. This set of data includes seven paintings: six boards with swatches of 19th-century pigments and one abstract painting created with those pigments called “19th-century pigment mockup.” This painting was used for 2D XRF, Raman and FORS measurement as well as for 3D scanning XRF measurement. This dataset was entered into the demo site using the Arches for Science Workflows and best shows the experimental use case used to develop the software.
- An open dataset from Open Context from several archaeological projects that have assigned elemental data to pottery sherds found in Anatolia, using Neutron Activation Analysis (NAA). This dataset includes information on the sherds, including elemental findings. However, the demo does not include the raw data files or the structured experimental information at this time. In the future, the full archaeological data and findings will be included in this demo.
Additional datasets will be added in the future to better demonstrate the features in Arches for Science. If you would like to donate a dataset for inclusion in the demo site, please contact us at contact@archesproject.org.
Demo Roadmap
The Arches for Science demo site will be updated continuously to reflect ongoing development of the Arches for Science application and to include additional datasets as mentioned above. If you have any questions or comments about the AfS demo, please post on the Arches Community Forum using the tag “arches-for-science”. If you find an error or bug, submit an issue via the Arches for Science Demo GitHub repository (https://github.com/archesproject/afs-demo/issues).
| Release Date | AfS Version | Arches Version | Notes |
|---|---|---|---|
| Jul/09/2025 | AfS v2.1 | v7.6.12 | Initial Release |
TUTORIALS
Features to Explore
The following tutorials highlight features such as search, related resources, the chart visualization of 2D data, and the IIIF image viewer and comparison tool.
Searching the data
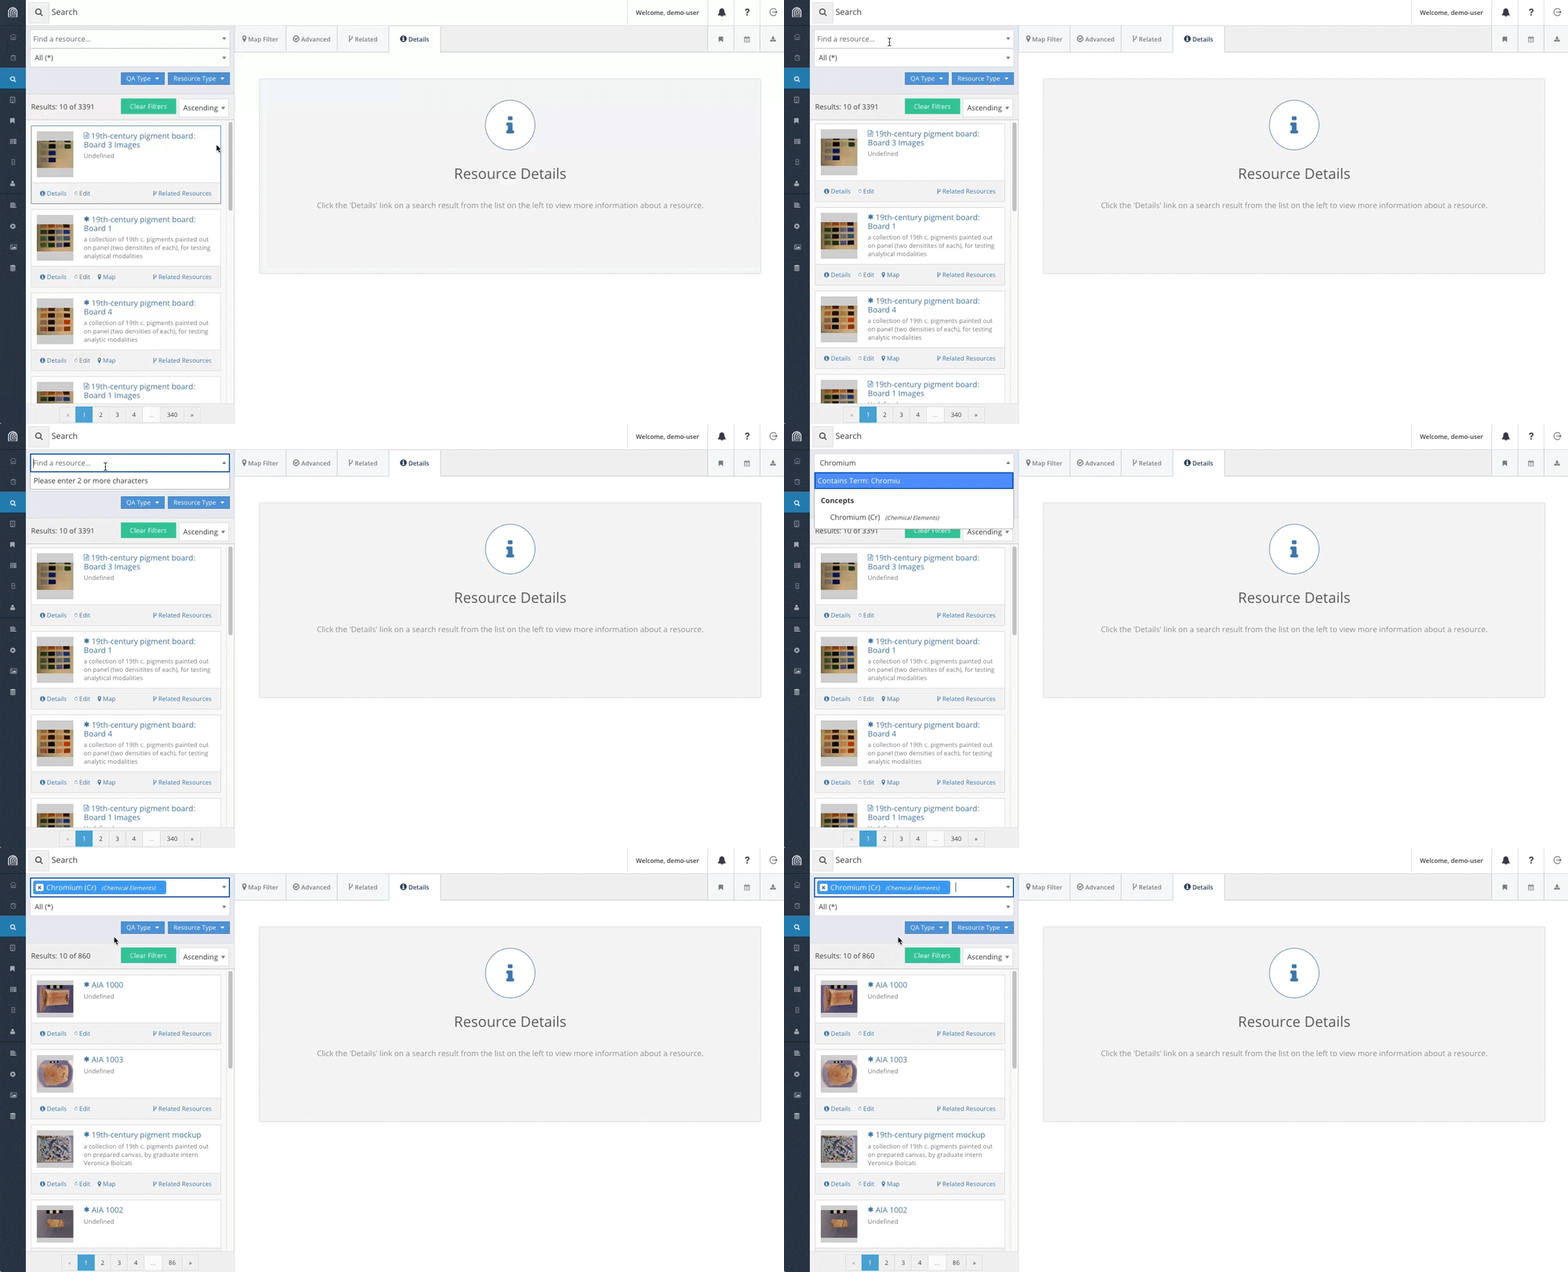
Arches for Science allows for search and discovery across different datasets. For example, a search for the element Chromium (or Cr) returns results from the two different datasets:
This shows that Chromium is found in objects that belong to different Projects, regardless of project methodology or instruments used.
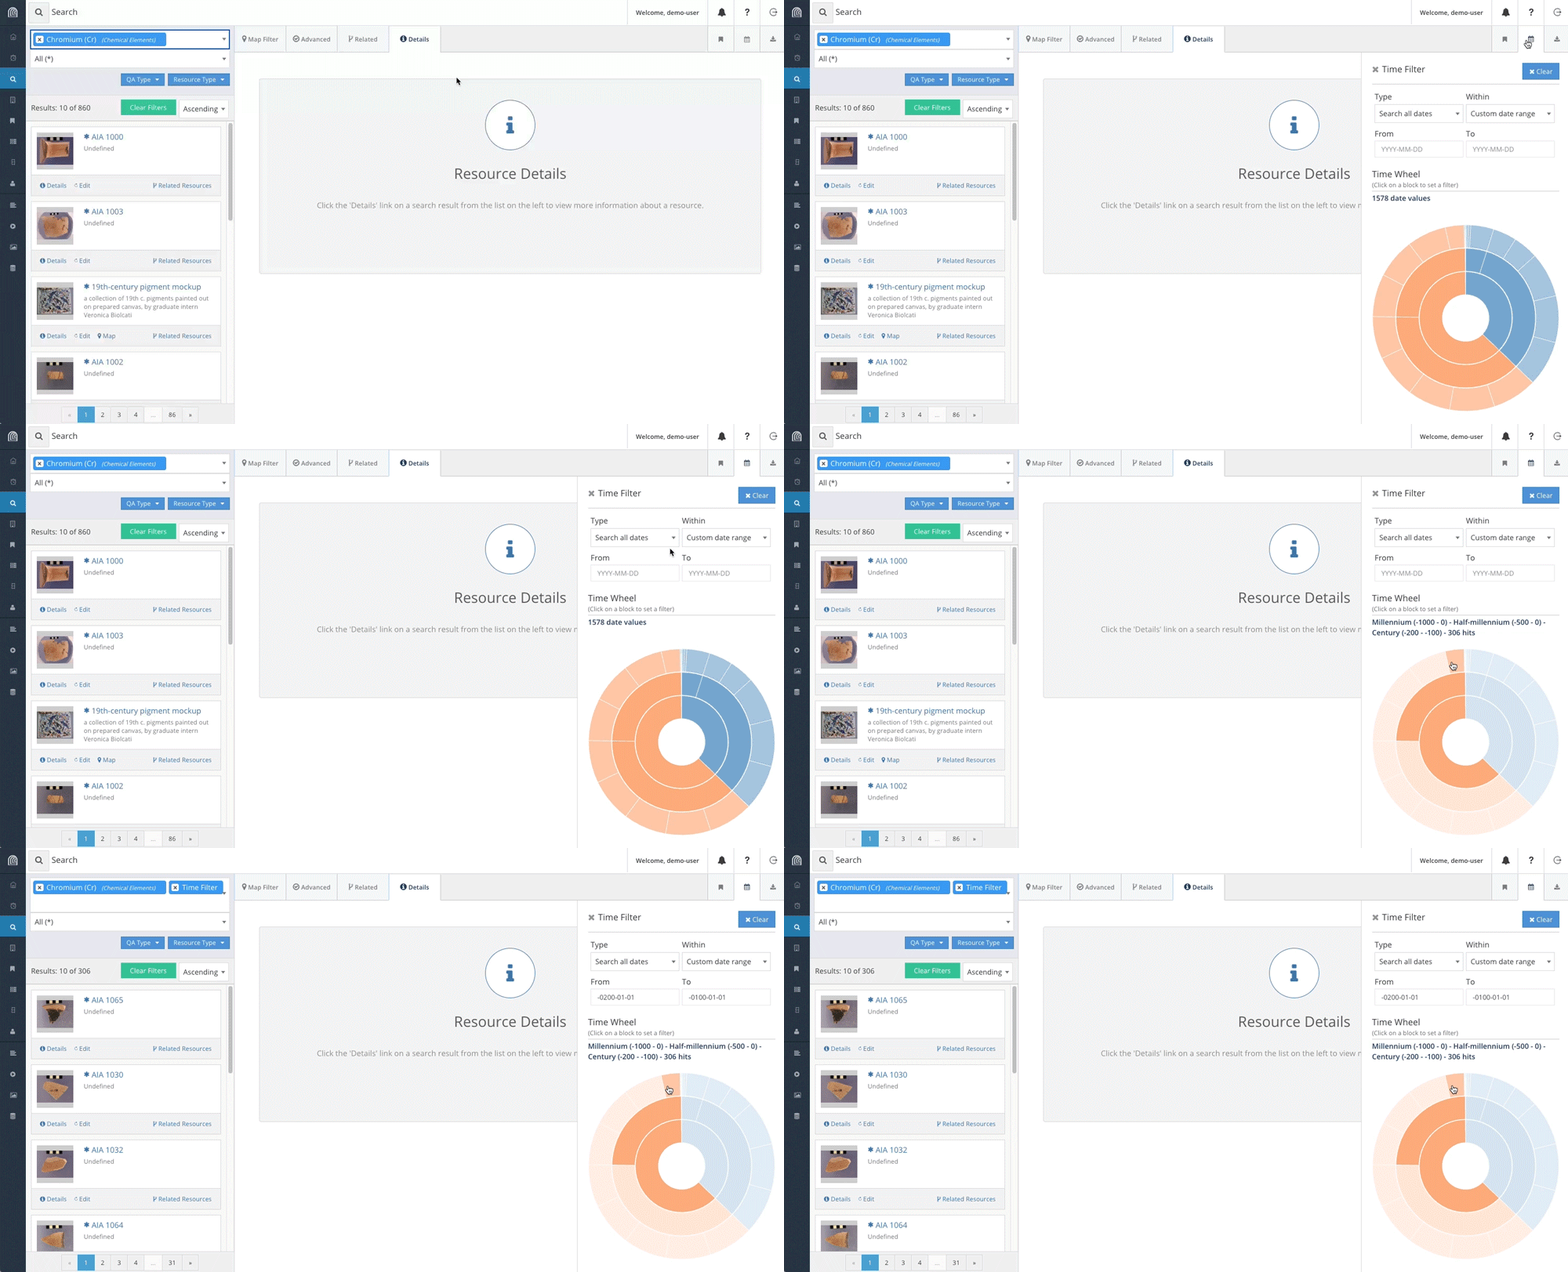
Temporal searches within Arches for Science can also be executed via the Time Wheel. The Time Wheel represents all time values within the Arches demo site in a histogram. To access the temporal searching, click on the calendar icon in the top right.
To filter based on time period, select the appropriate slice. In this case, select the time slice associated with the 2nd Century BCE (i.e. Millennium (-1000 – 0) – Half-millennium (-500 – 0) – Century (-200 – -100))
The search results have been filtered for resources that contain Chromium (Cr) and have a creation date that encompasses or intersects with the 2nd Century BCE. As a reminder, a core feature of Arches is the ability to record and search using fuzzy (or uncertain) dates. For more information on this, see this video discussing the EDTF data type, which is part of a larger webinar on data technology concepts in Arches.
Exploring data connections
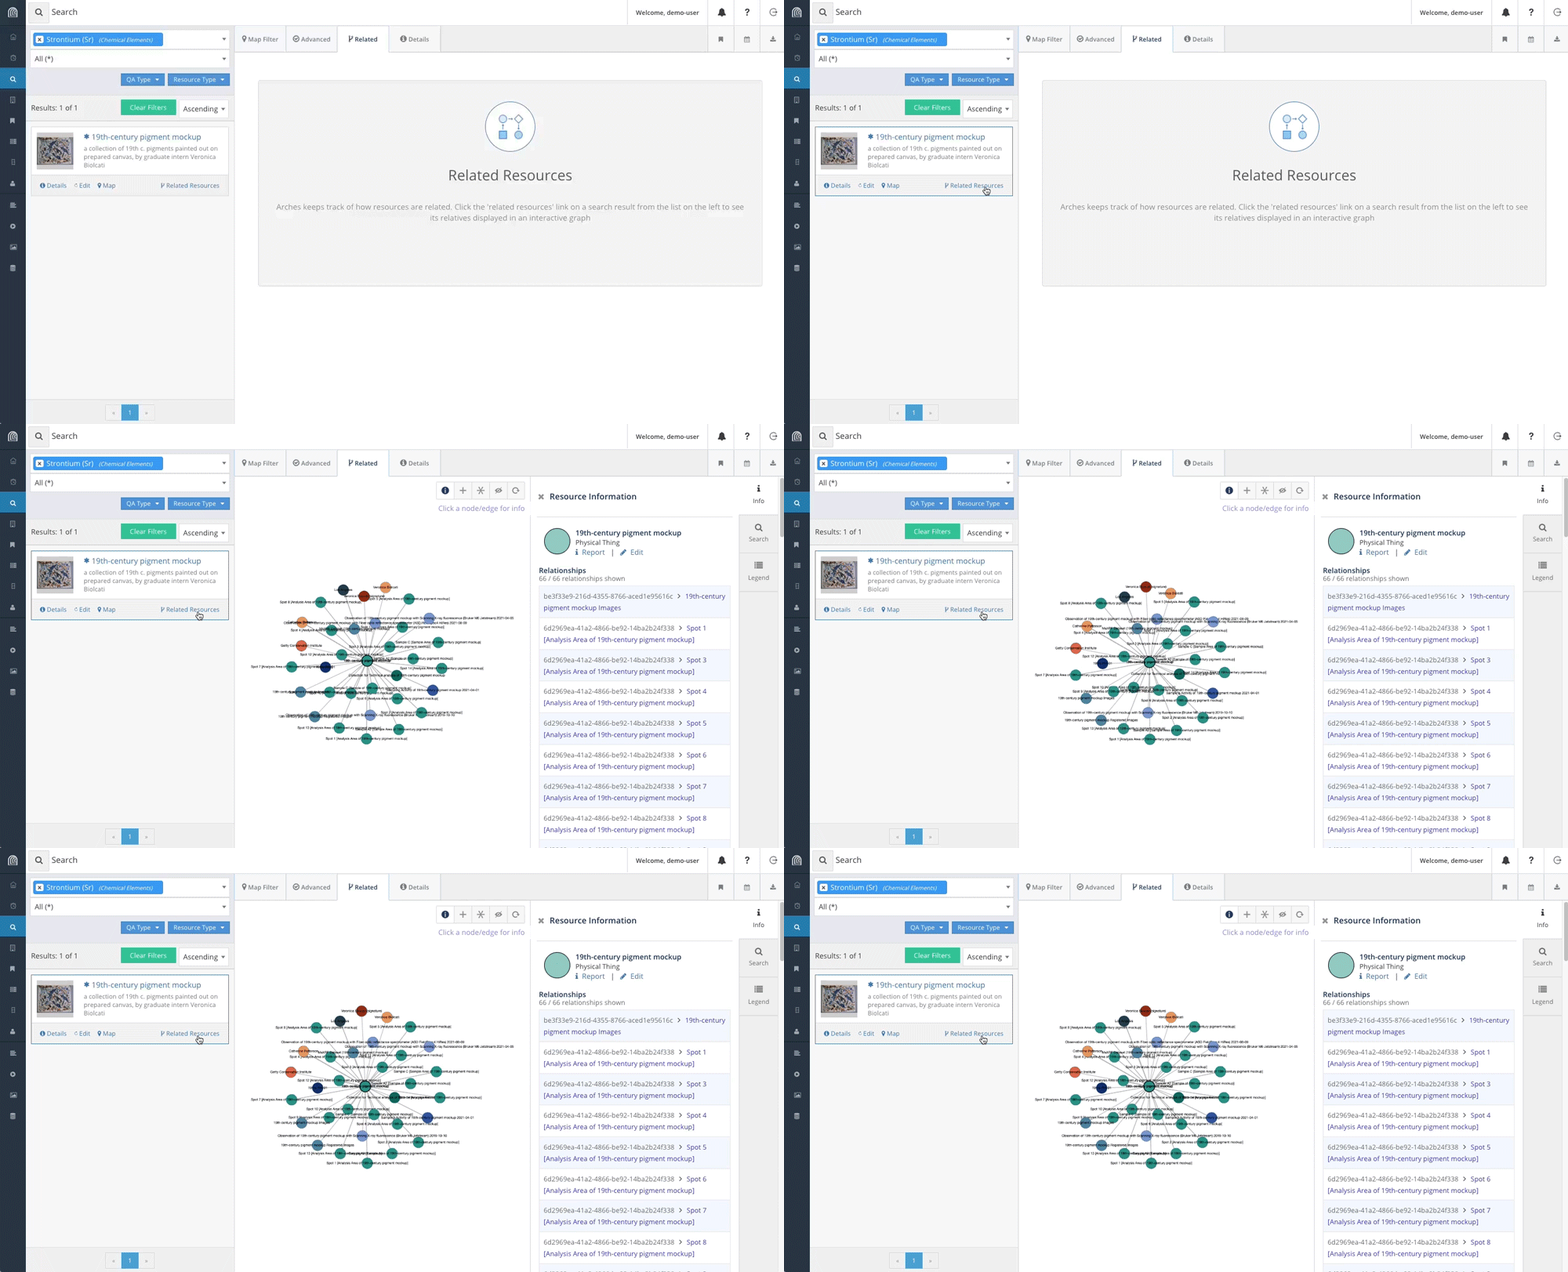
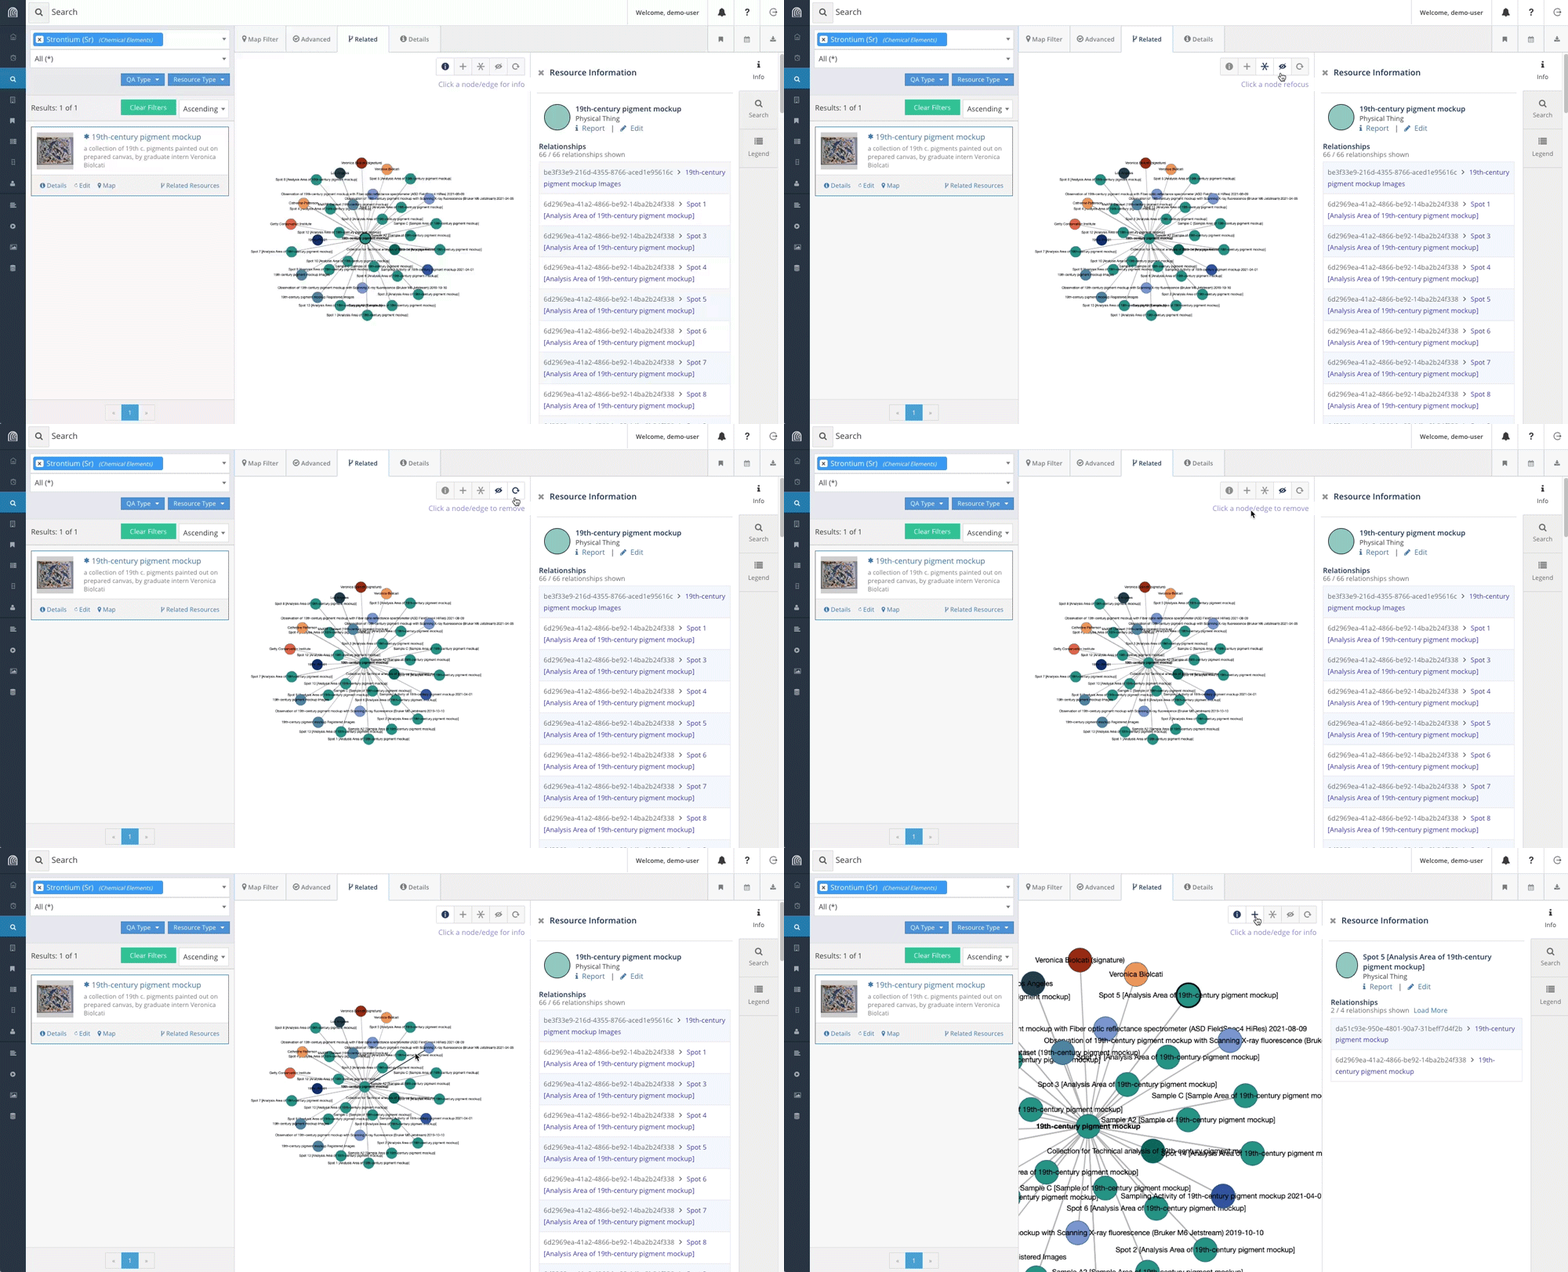
Using Arches for Science, you can explore data connections through the Related Resources graph. To access this graph for any resource, click on the Related Resources for any search result:
The Related Resources graph represents all of the resources connected to the search result. In this example, the Physical Thing “19th-century pigment mockup” is connected to various People and Groups, Projects, Observations, Sampling Activities, and other Physical Things.
In order to interact with the graph, you can use the control panel to the immediate top right of the graph to define what clicking on a node will do.
- The
 button selects which node/resource is highlighted in the right hand panel.
 - The
 button expands the graph by showing the relationships of a selected node.
 - The
 button redefines the center node.
 - The
 button removes a node from view in the graph.
 - The
 button redistributes nodes in the graph.
Here is an example of how this works:
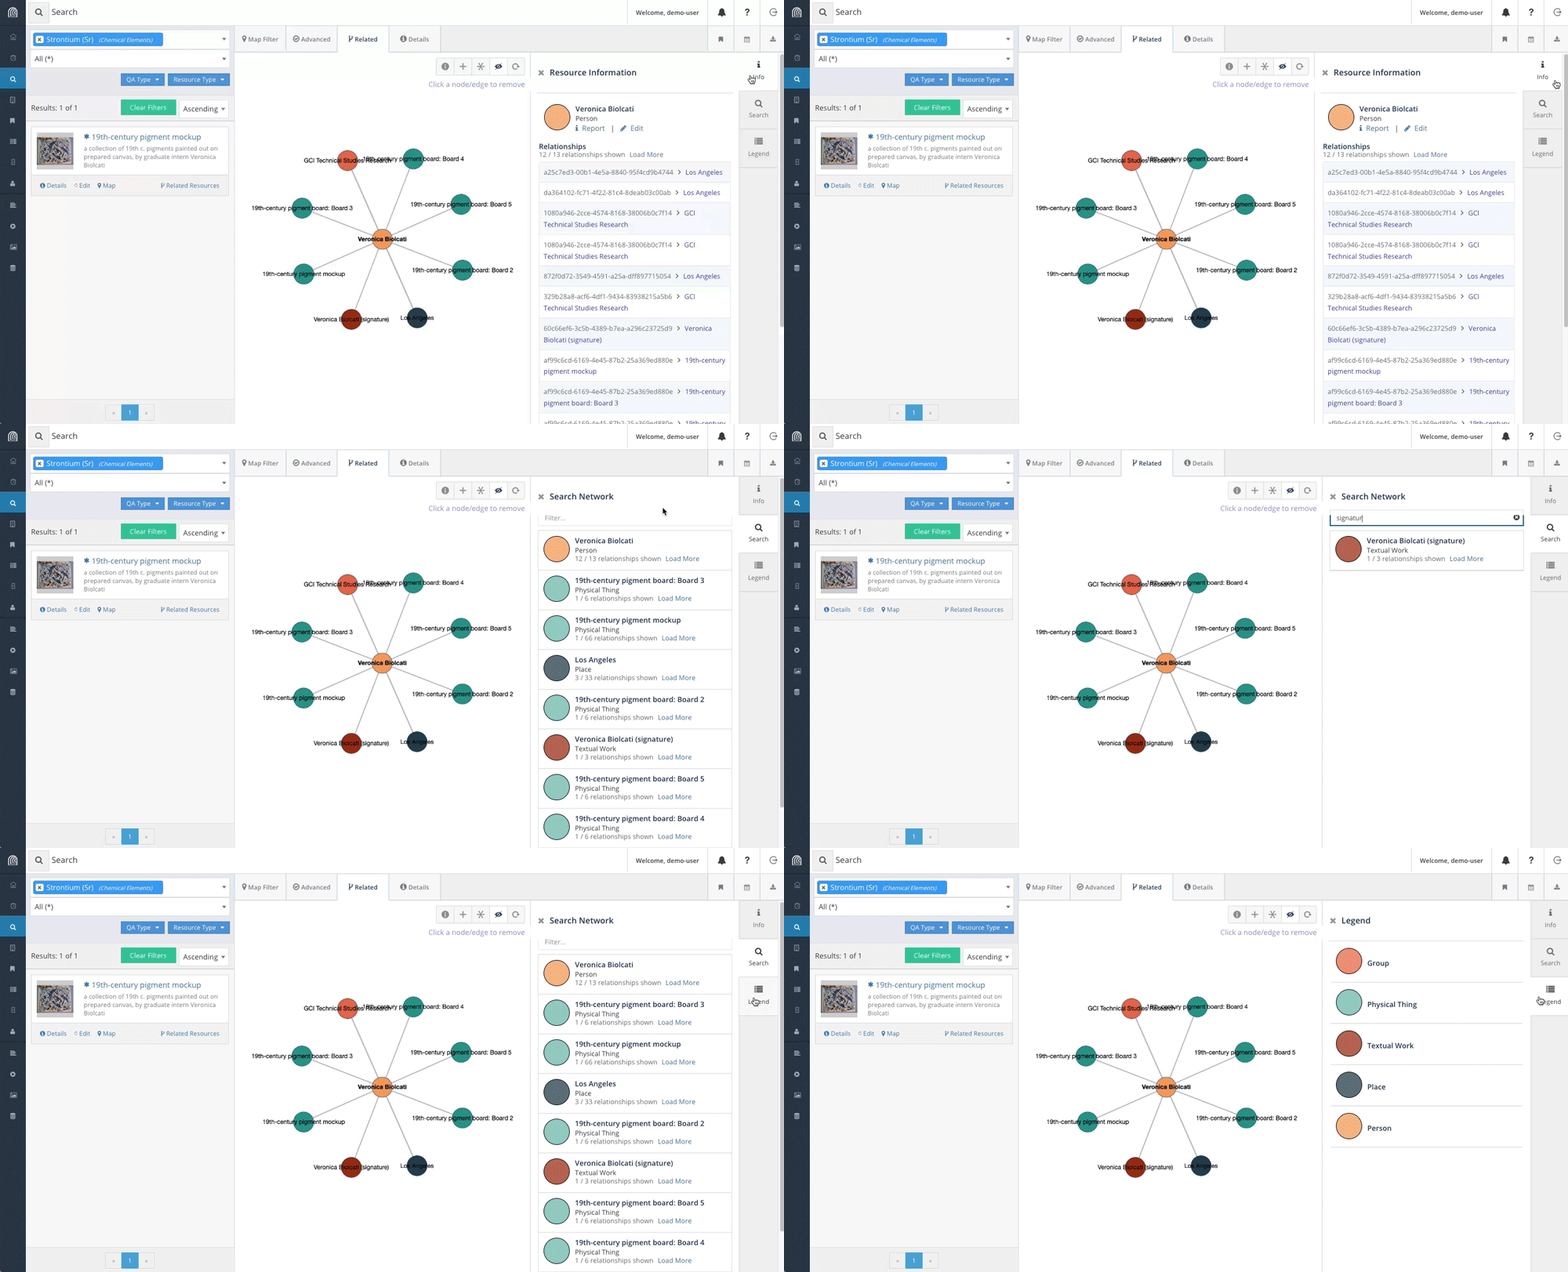
In addition, the panel on the right hand offers additional ways to navigate through resource relationships.
- The Info tab shows the resources that are directly related to the resource selected using the
 button.
 - The Search tab filters through the names of the visible resources.
- The Legend tab shows what colors are associated with each resource type.
Visualization of 2D instrument data
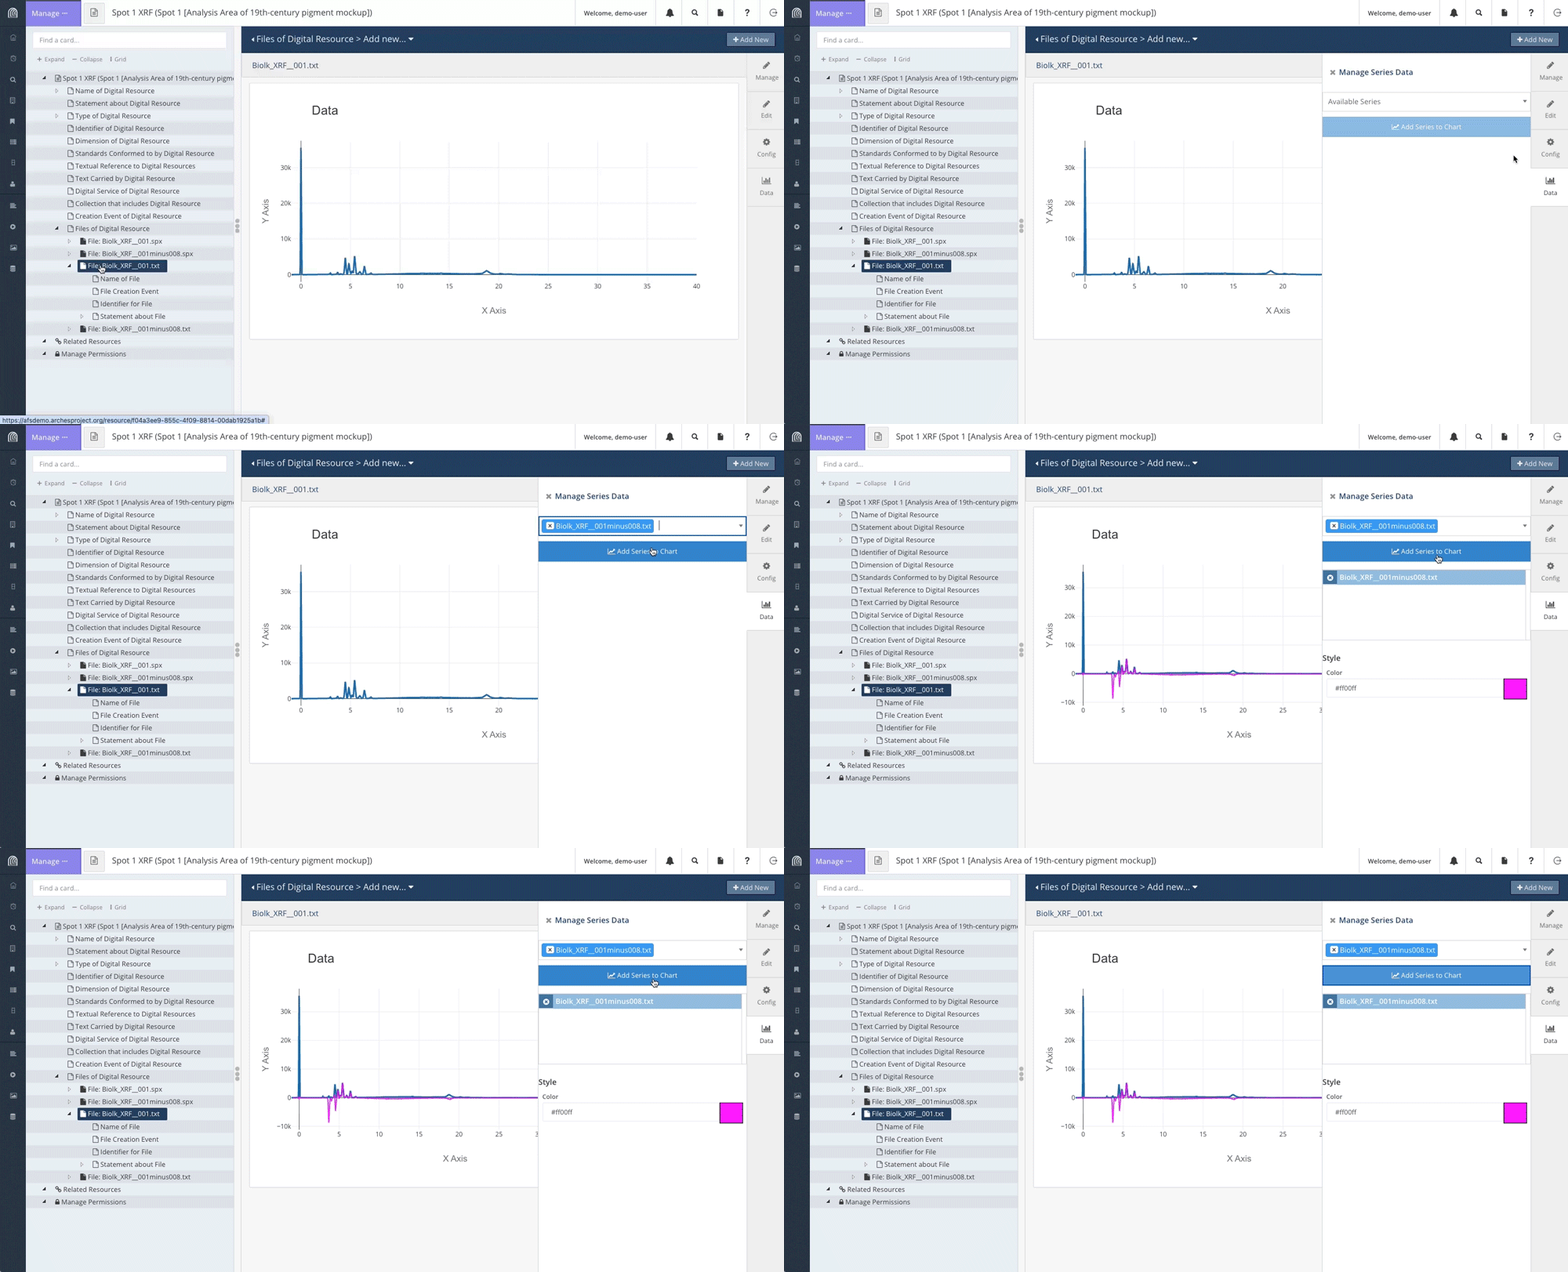
Arches for Science can visualize 2D instrument data files in an interactive chart. For an example of this, follow this link: https://afsdemo.archesproject.org/resource/f04a3ee9-855c-4f09-8814-00dab1925a1b.
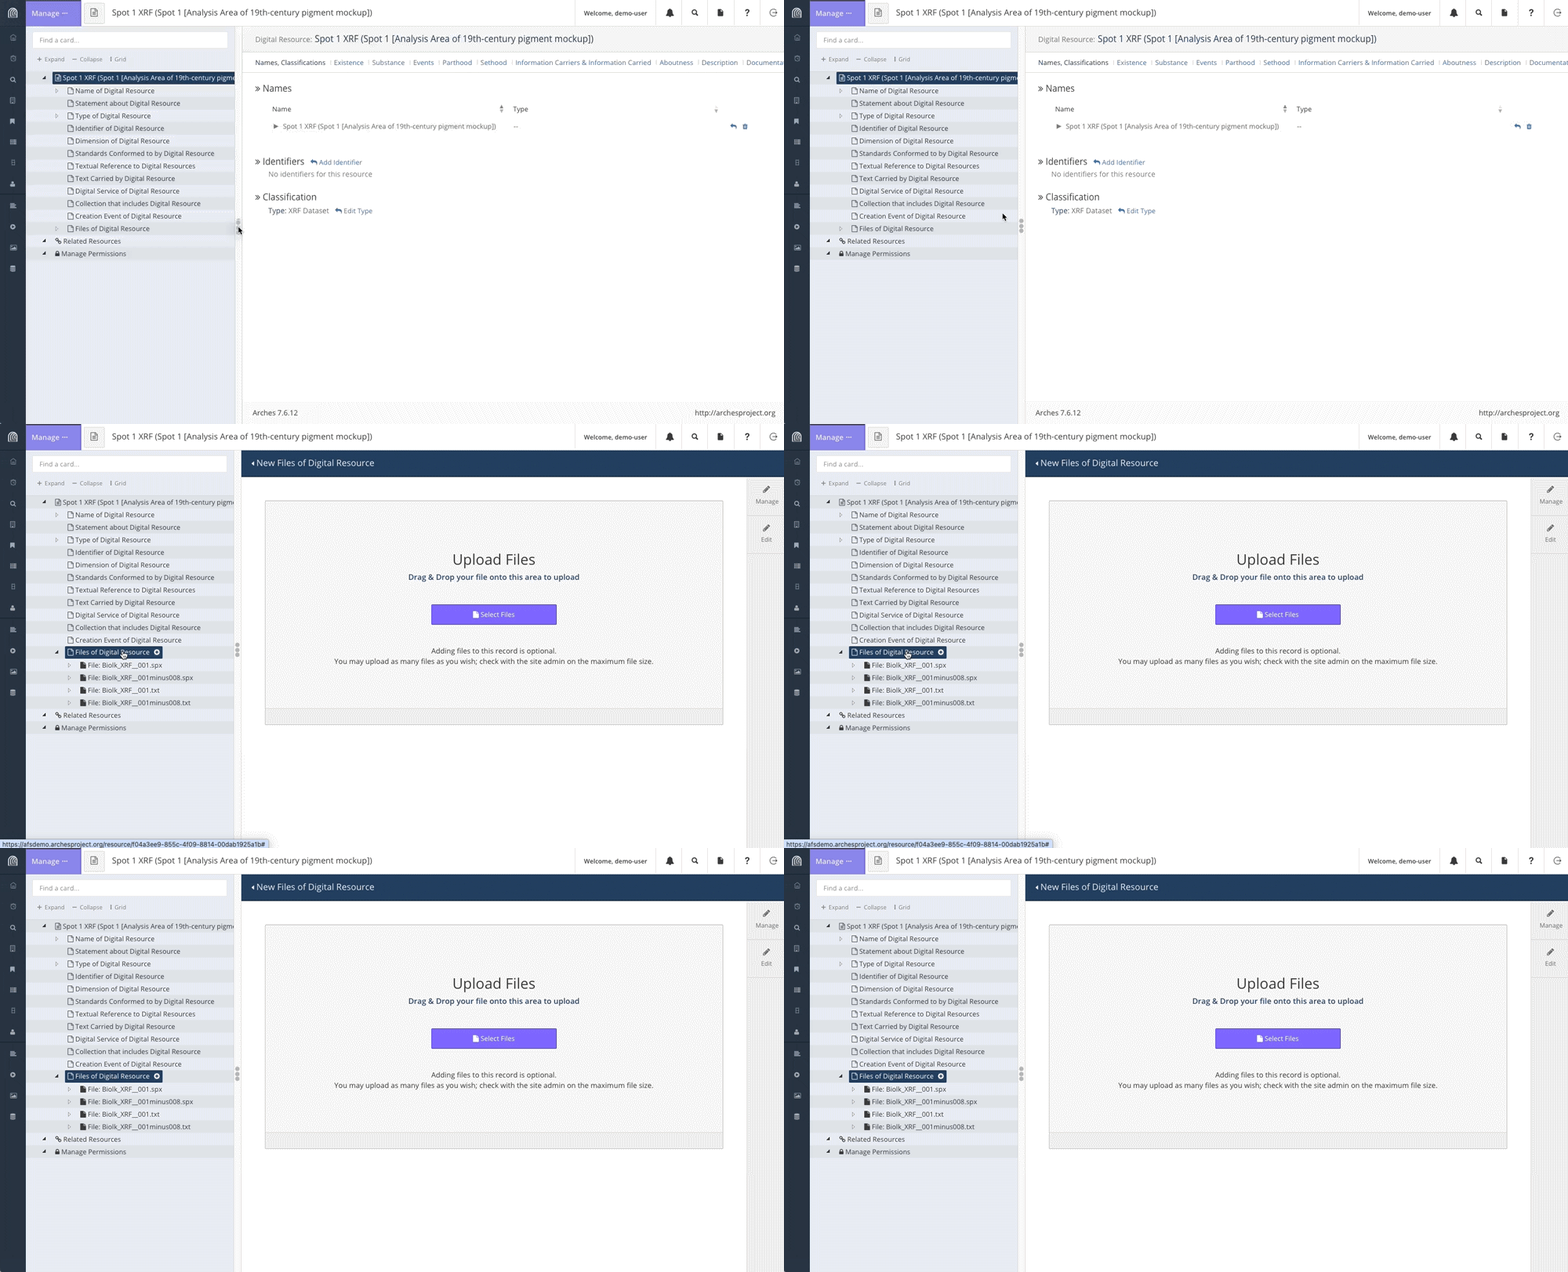
This shows the resource editor view of the Digital Resources instance “Spot 1 XRF (Spot 1 [Analysis Area of 19th-century pigment mockup])”. This is a dataset which represents all of the XRF files that are associated with the Spot 1 analysis area of the Physical Thing “19th-century pigment mockup”. In the left hand panel, which shows the data entry entry fields in a hierarchical tree, click on Files of Digital Resource to see what instrument files have already been associated with this analysis area.
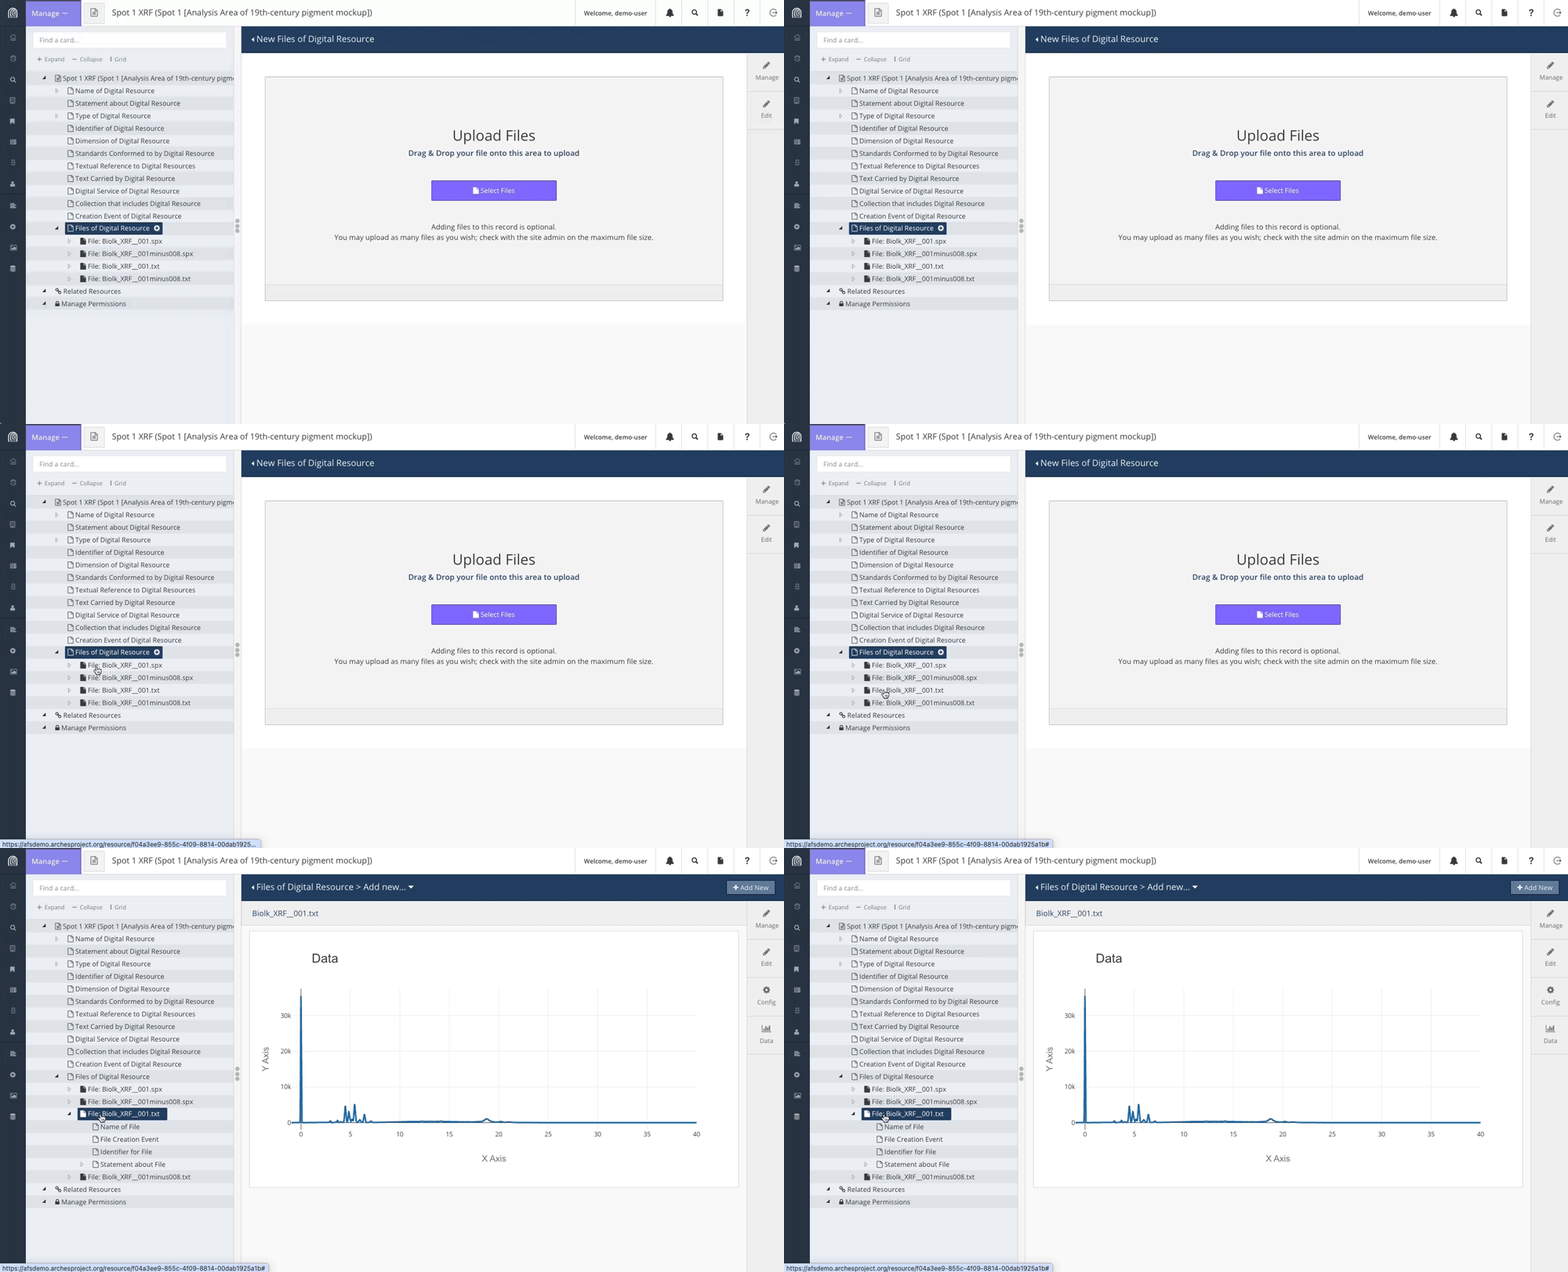
The files for Spot 1 include both raw instrument files and files that have been exported and reformatted as ASCII .txt files. Arches for Science can store any file type, but can only visualize files that have been reformatted as ASCII. Given this, by clicking on the file “Biolk_XRF_001.txt”, its data is presented in an interactive chart.
Two files can be compared on the same chart by clicking on the Data tab on the right hand side of the chart. By selecting “Biolk_XRF_001minus008.txt” in the dropdown under Manage Series Data and then clicking on Add Series to Chart, both XRF data files are visualized on one chart.
IIIF Image Viewer and Comparison Tool
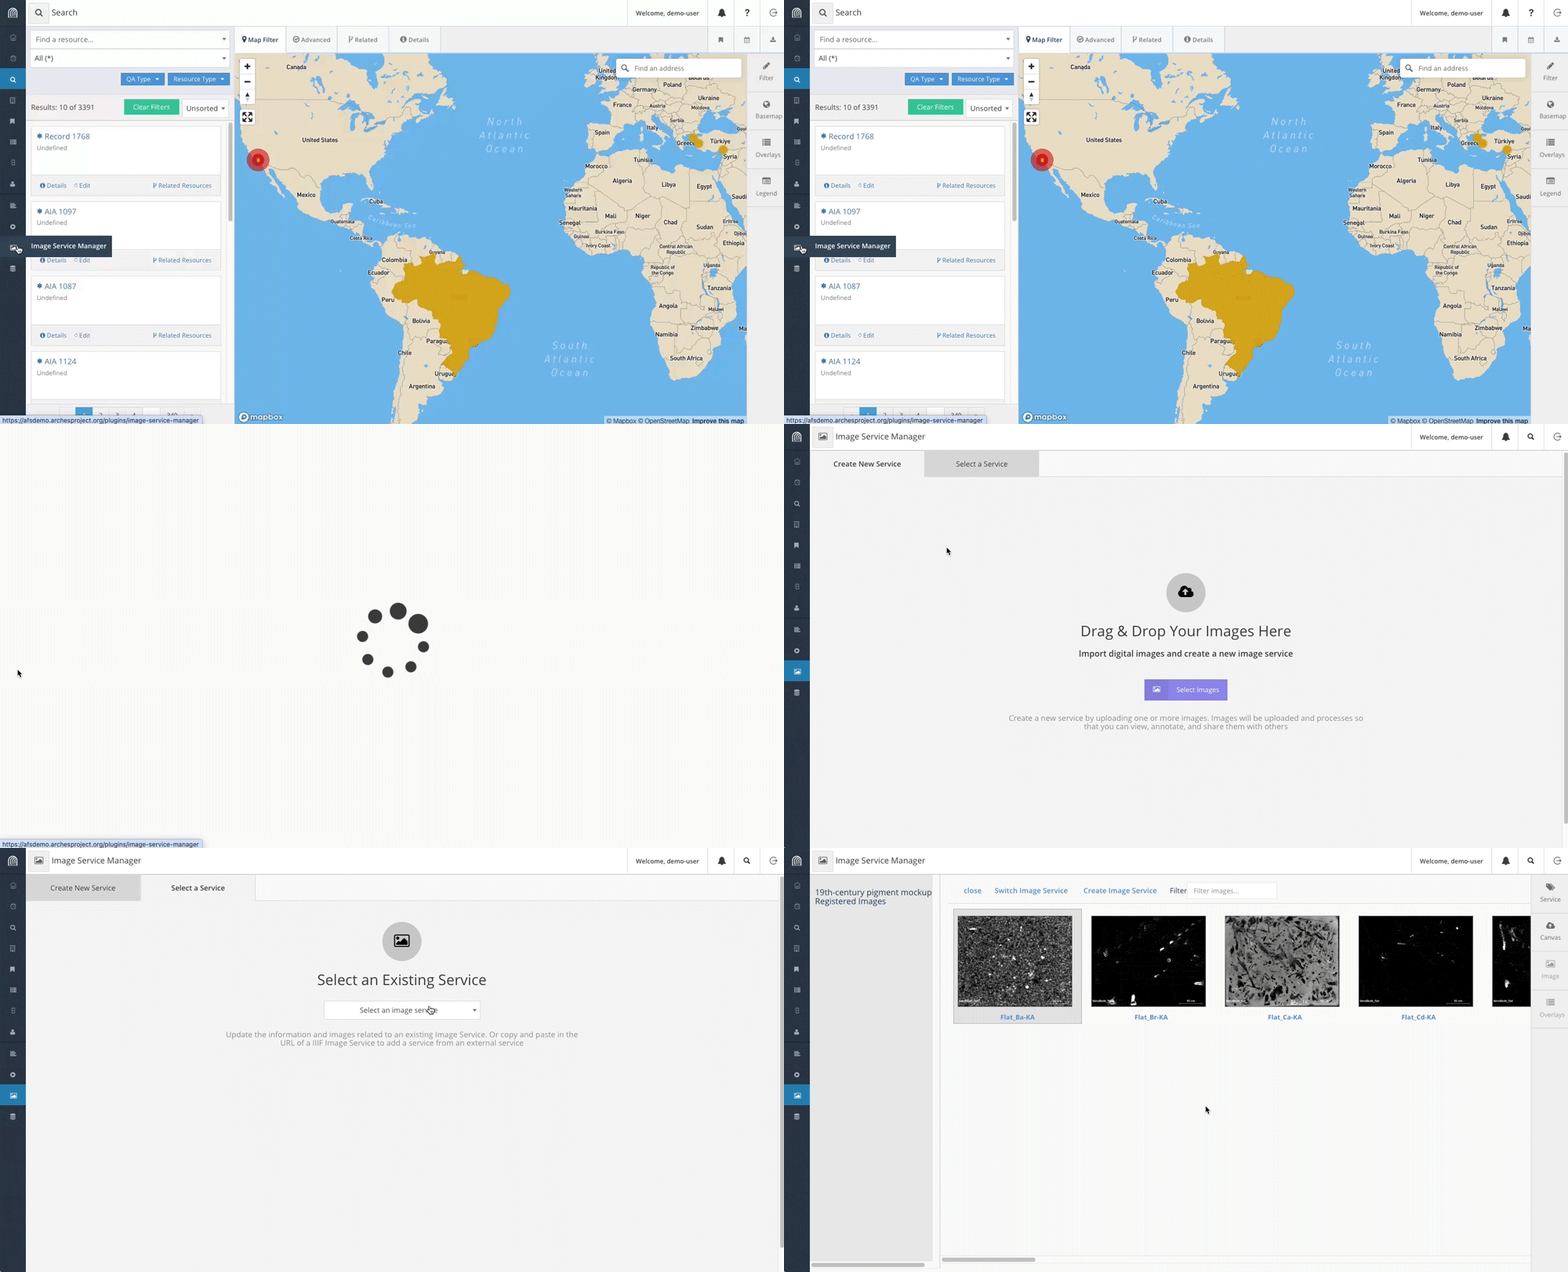
Arches for Science includes the Image Services Manager, based on the International Image Interoperability Framework (IIIF), and can create and serve IIIF Image Manifests as well as present external IIIF Images Manifests.
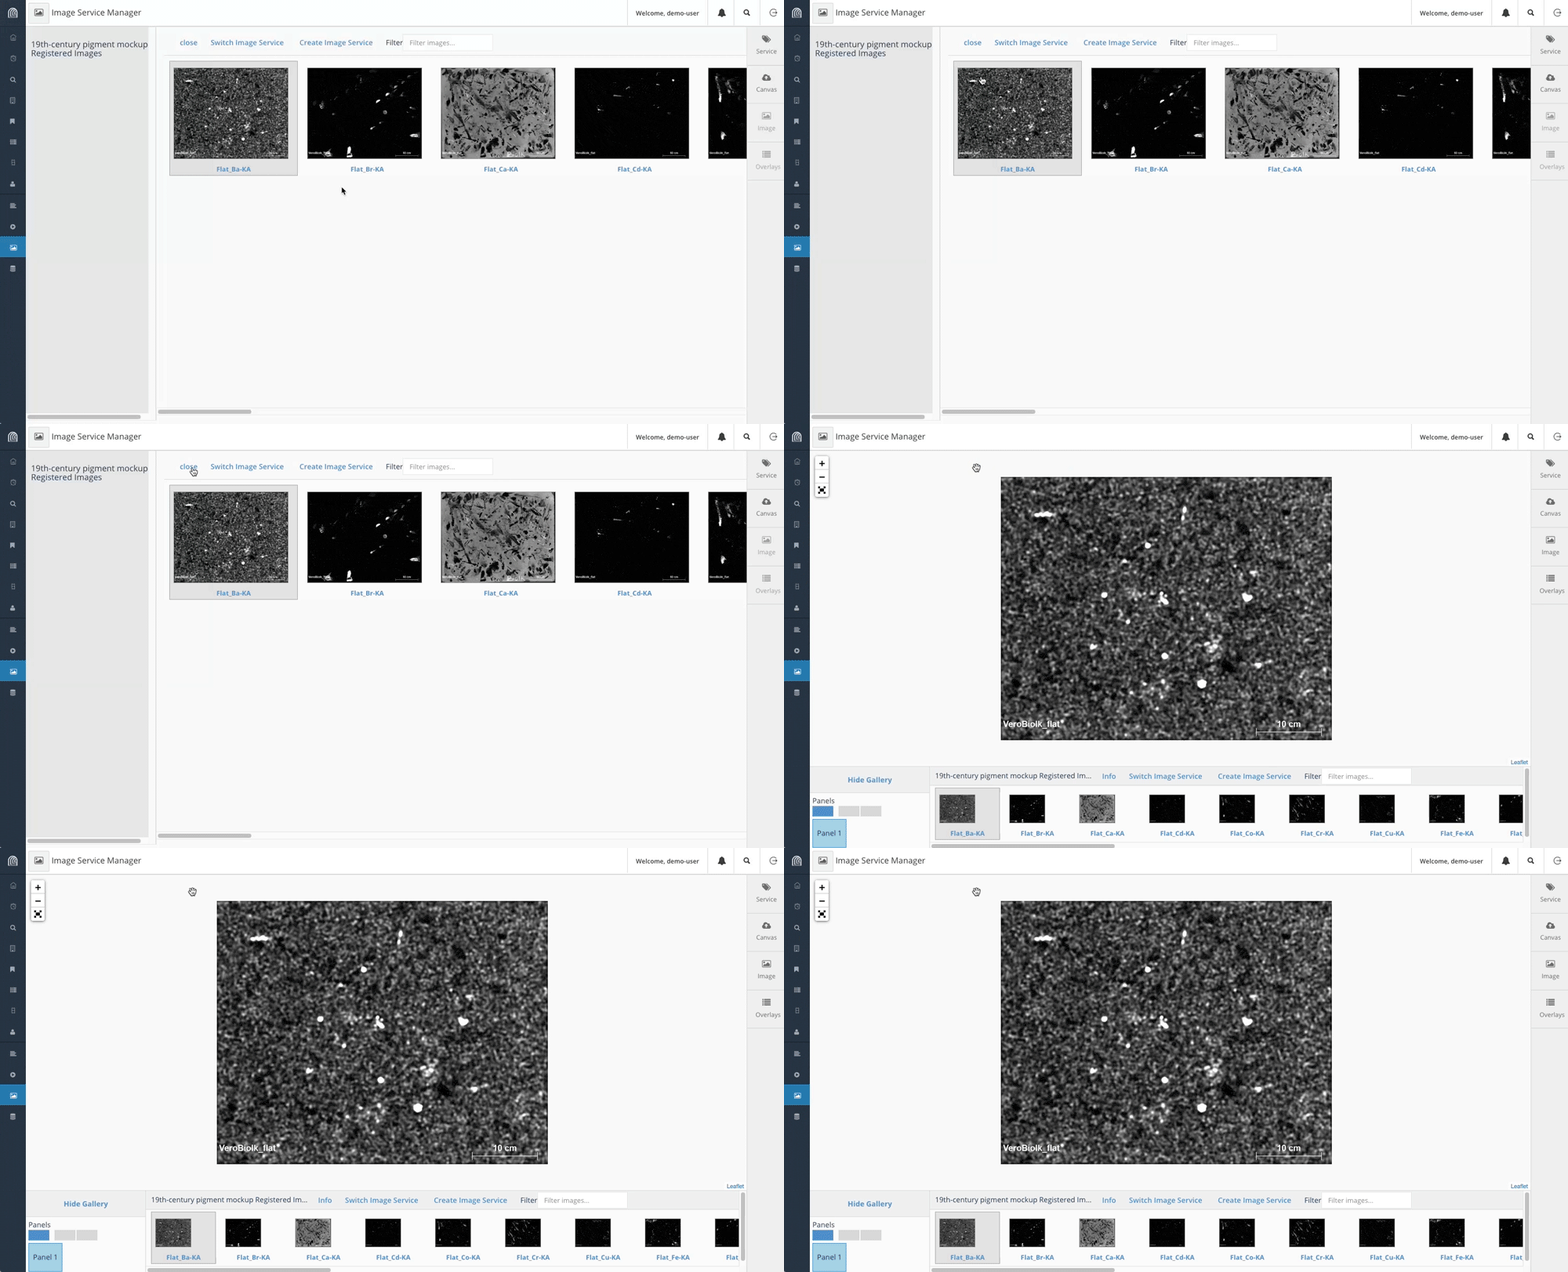
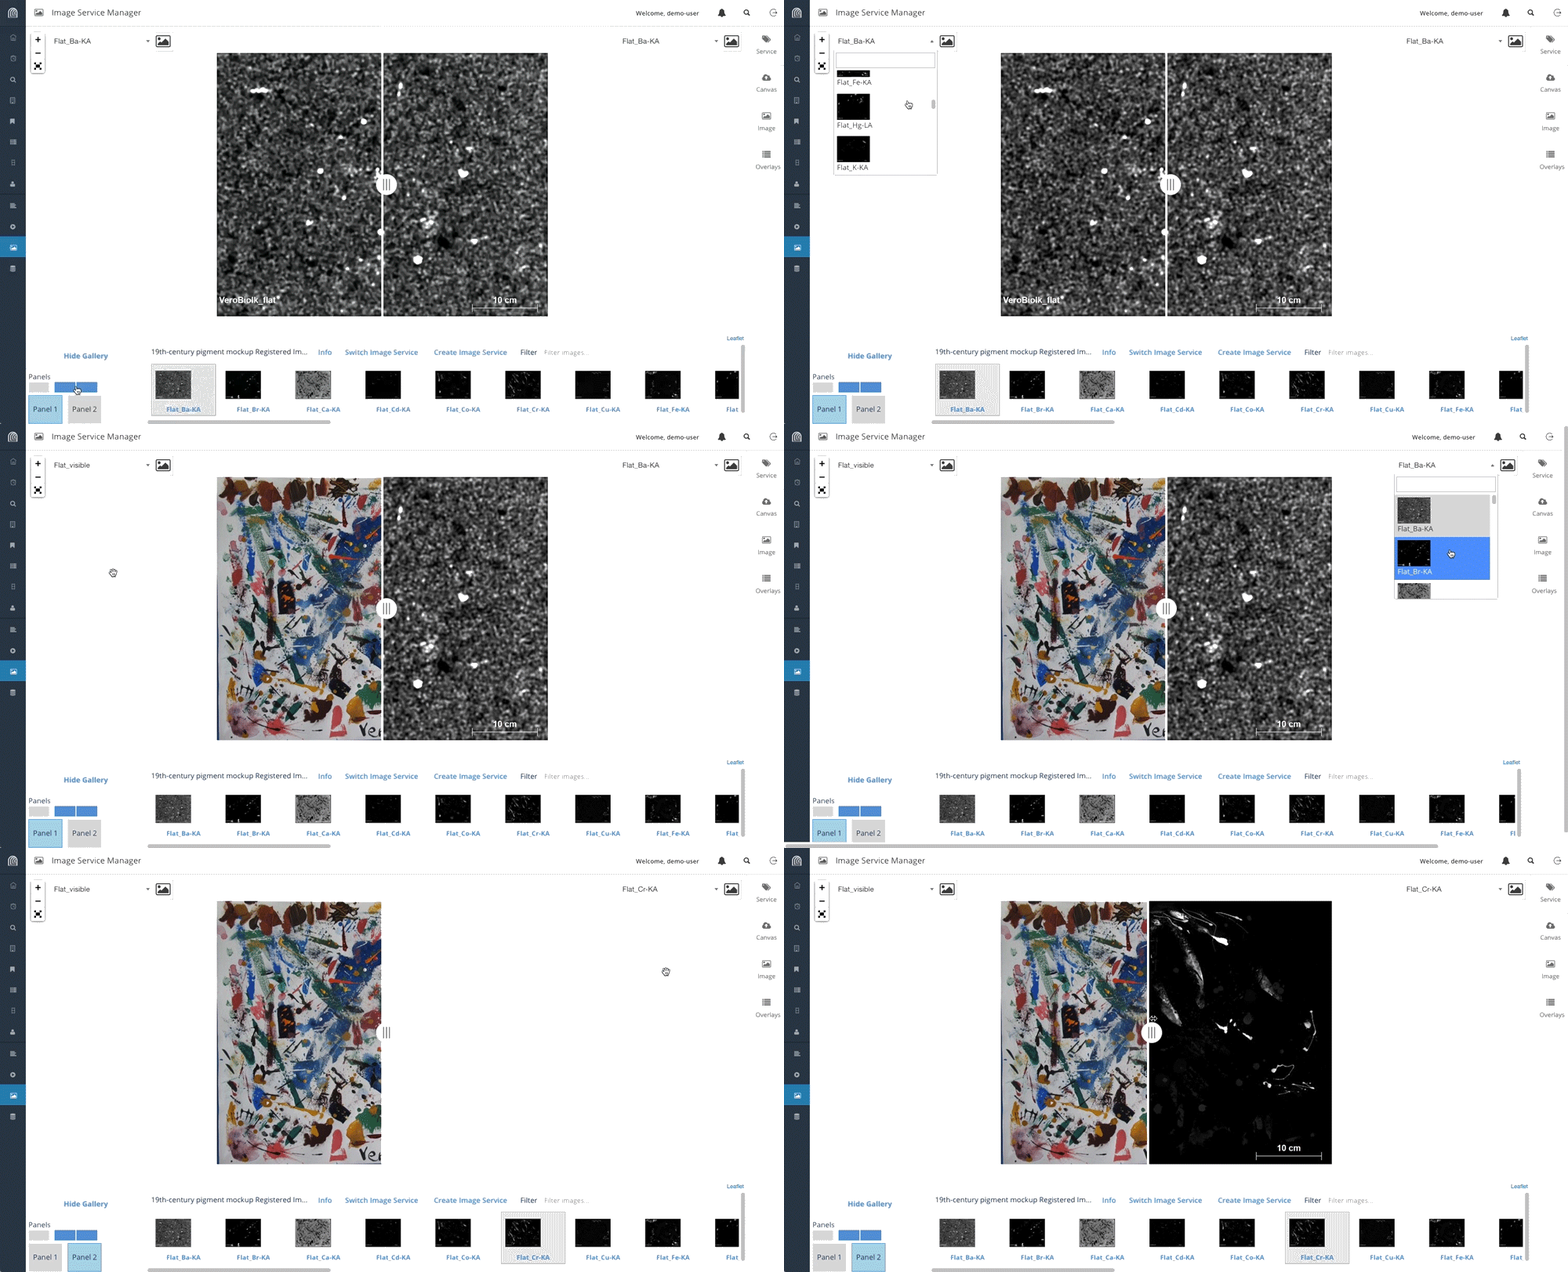
In the Image Services Manager, you can compare two canvasses (or images) in the same manifest using a sliding comparison tool. To see this in action, click on the Image Services Manager button and select the tab Select a Service. From the dropdown menu under Select an Existing Service, select “19th-century pigment mockup Registered Images.”
On the next screen, click on Close to see a view with a large image with a gallery of canvasses at the bottom.
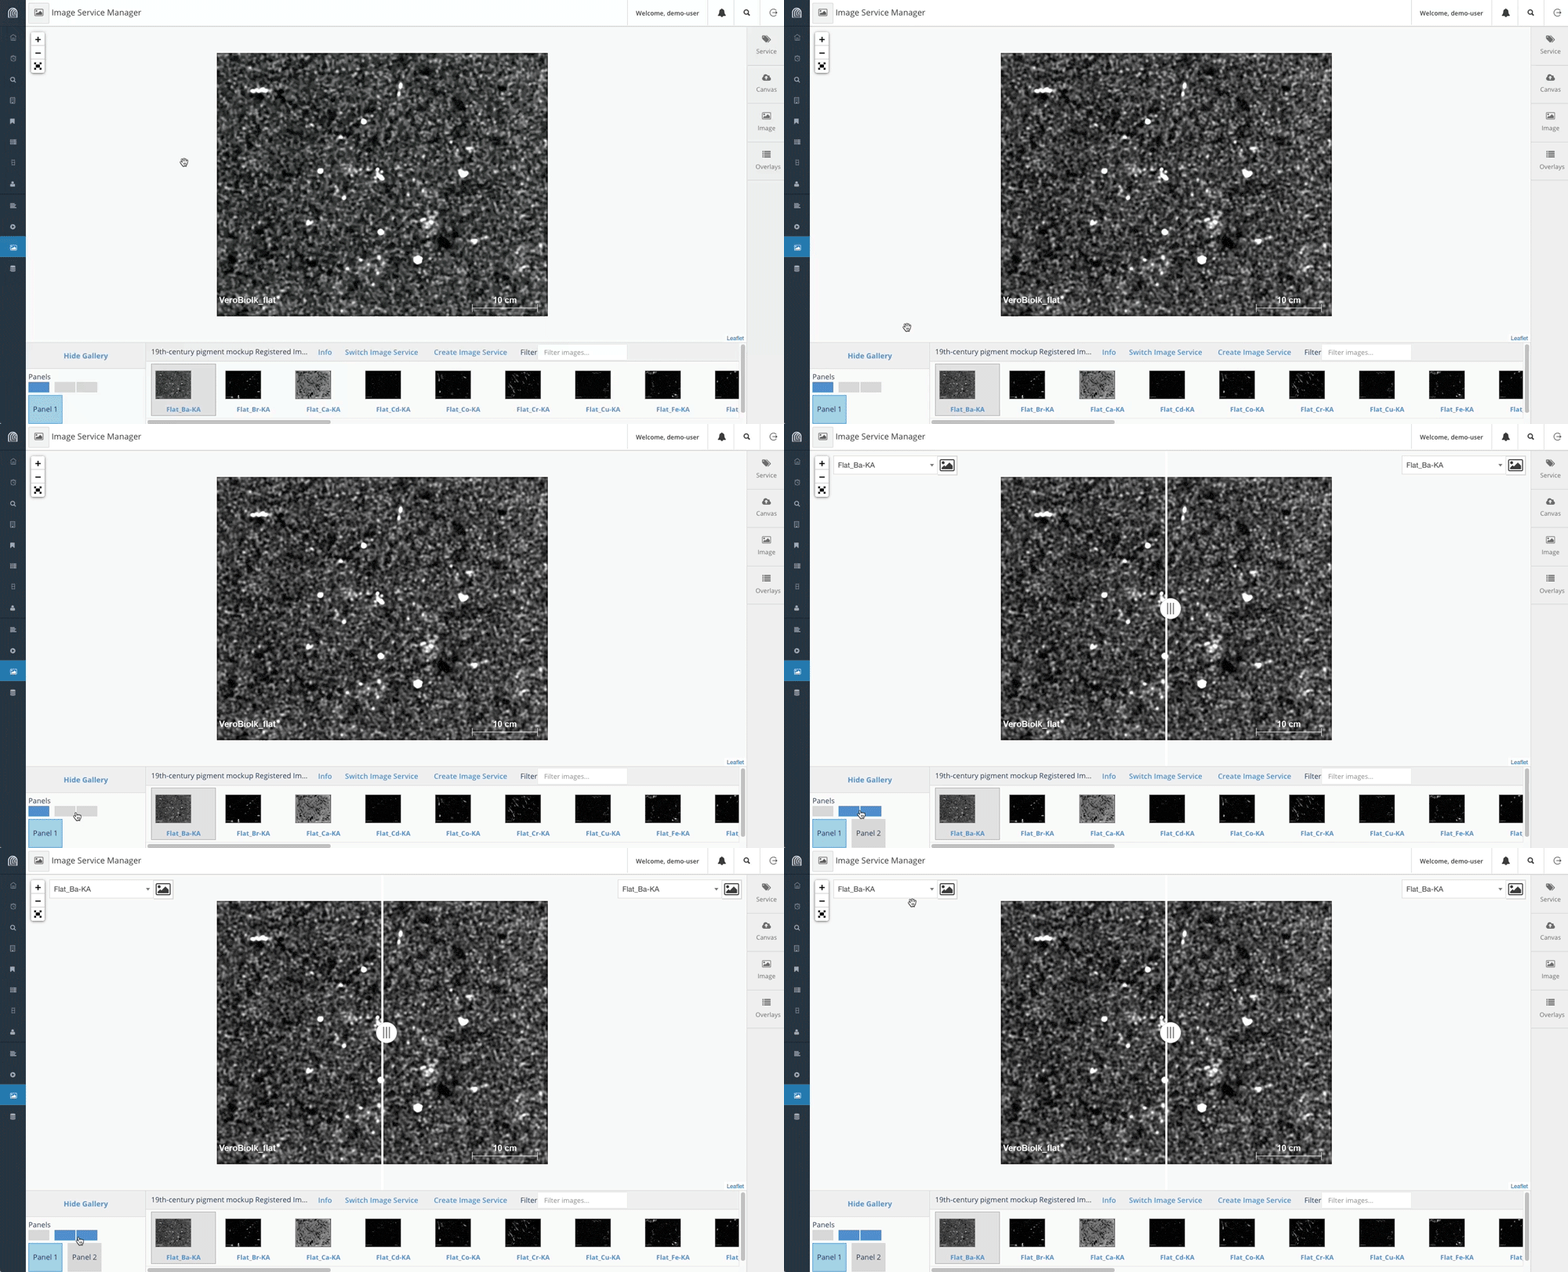
Next, on the bottom left hand corner, click on the button to show two panels to enable the comparison tool.
In the dropdown in the top left hand corner, select “flat_visible”, which is a photographic image of the painting “19th-century pigment mockup.” In the dropdown in the top right corner, select “Flat_Cr-KA”, which is an elemental map showing Chromium. You can now click and drag the slider button to compare the two images and see what parts of the painting exhibit Chromium.
Explore the Arches for Science Workflows
In this tutorial, we will demonstrate the included workflows for data creation in Arches for Science. Note that this represents one of several ways to input data into Arches for Science.
This process leverages Arches Workflows, which offer users step-by-step guidance to create the essential data needed for a particular project. Workflows are customized according to an organization’s needs and customized according to how organizations model their data.
You can try out the Arches for Science workflows for yourself by following the instructions below.
Manage Projects: Create and Edit a Project
Arches for Science uses Projects as an organizing principle to group data generated for a particular purpose. While Physical Things (or objects) can participate in numerous projects, the activities surrounding them generally fall under one Project.
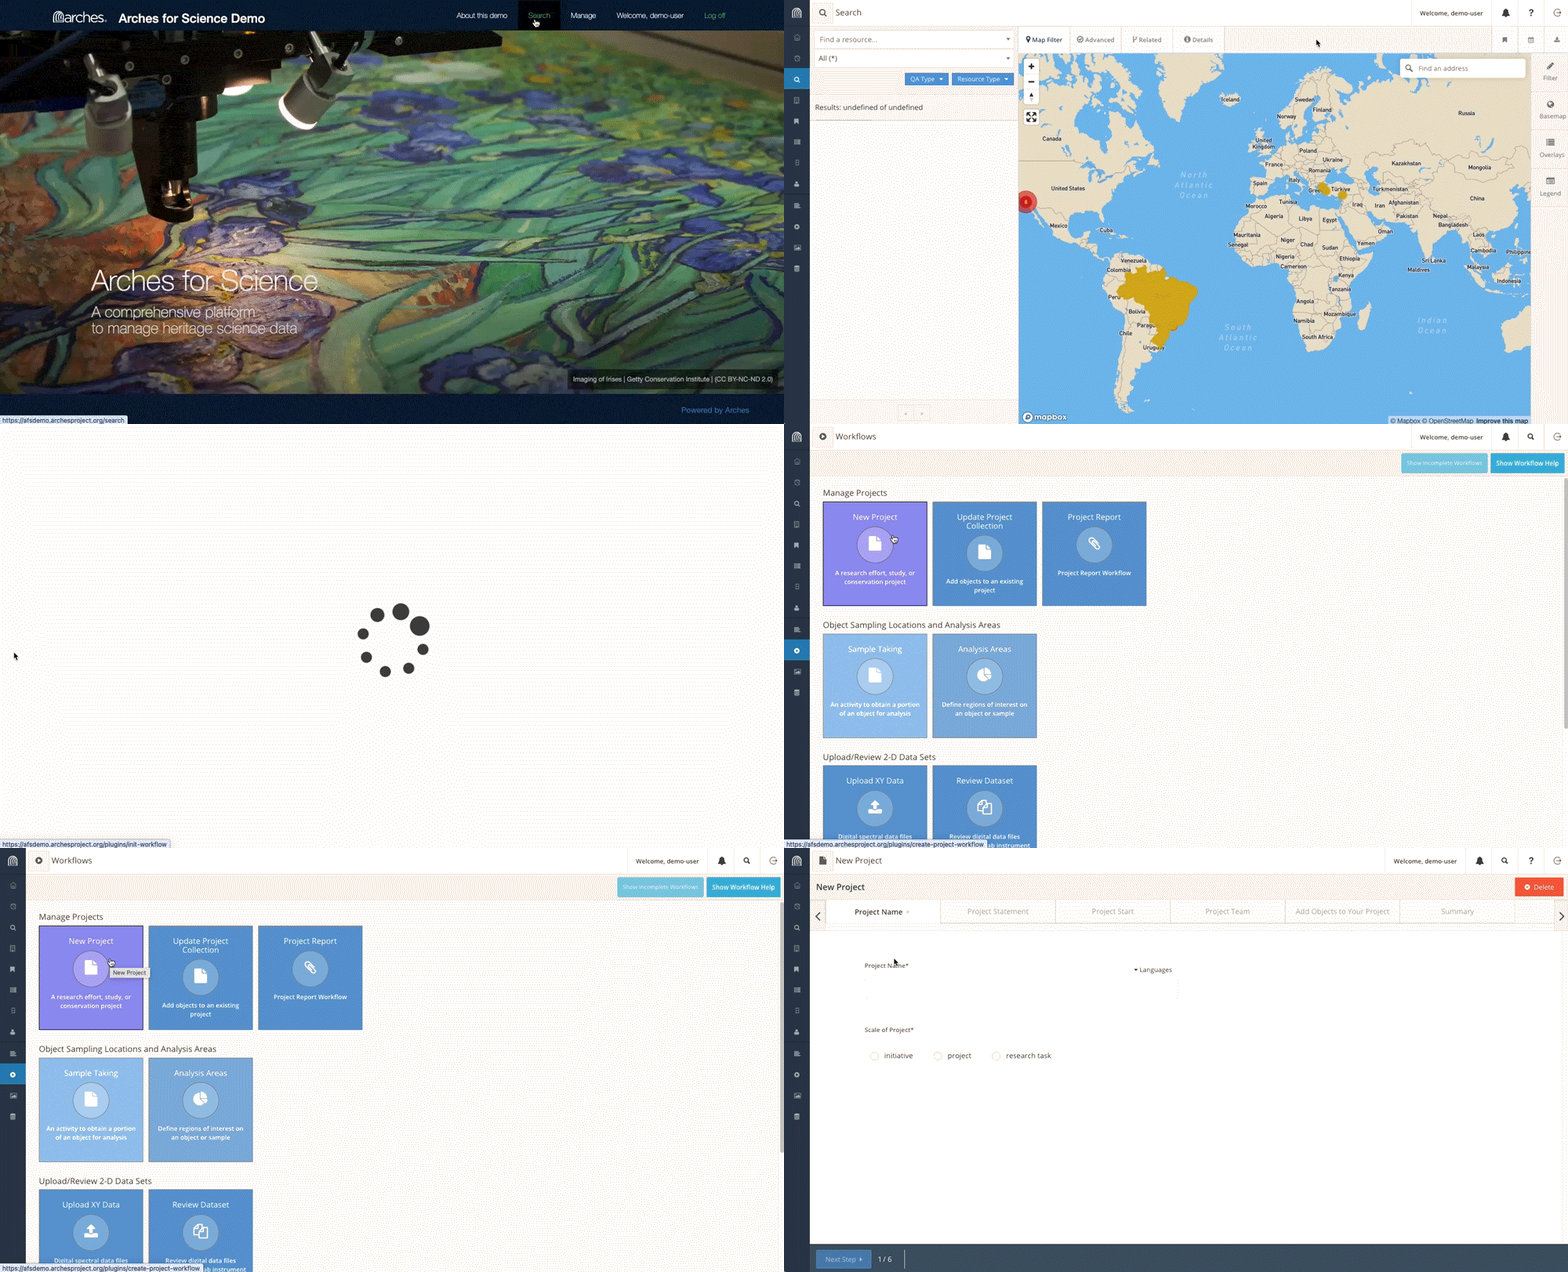
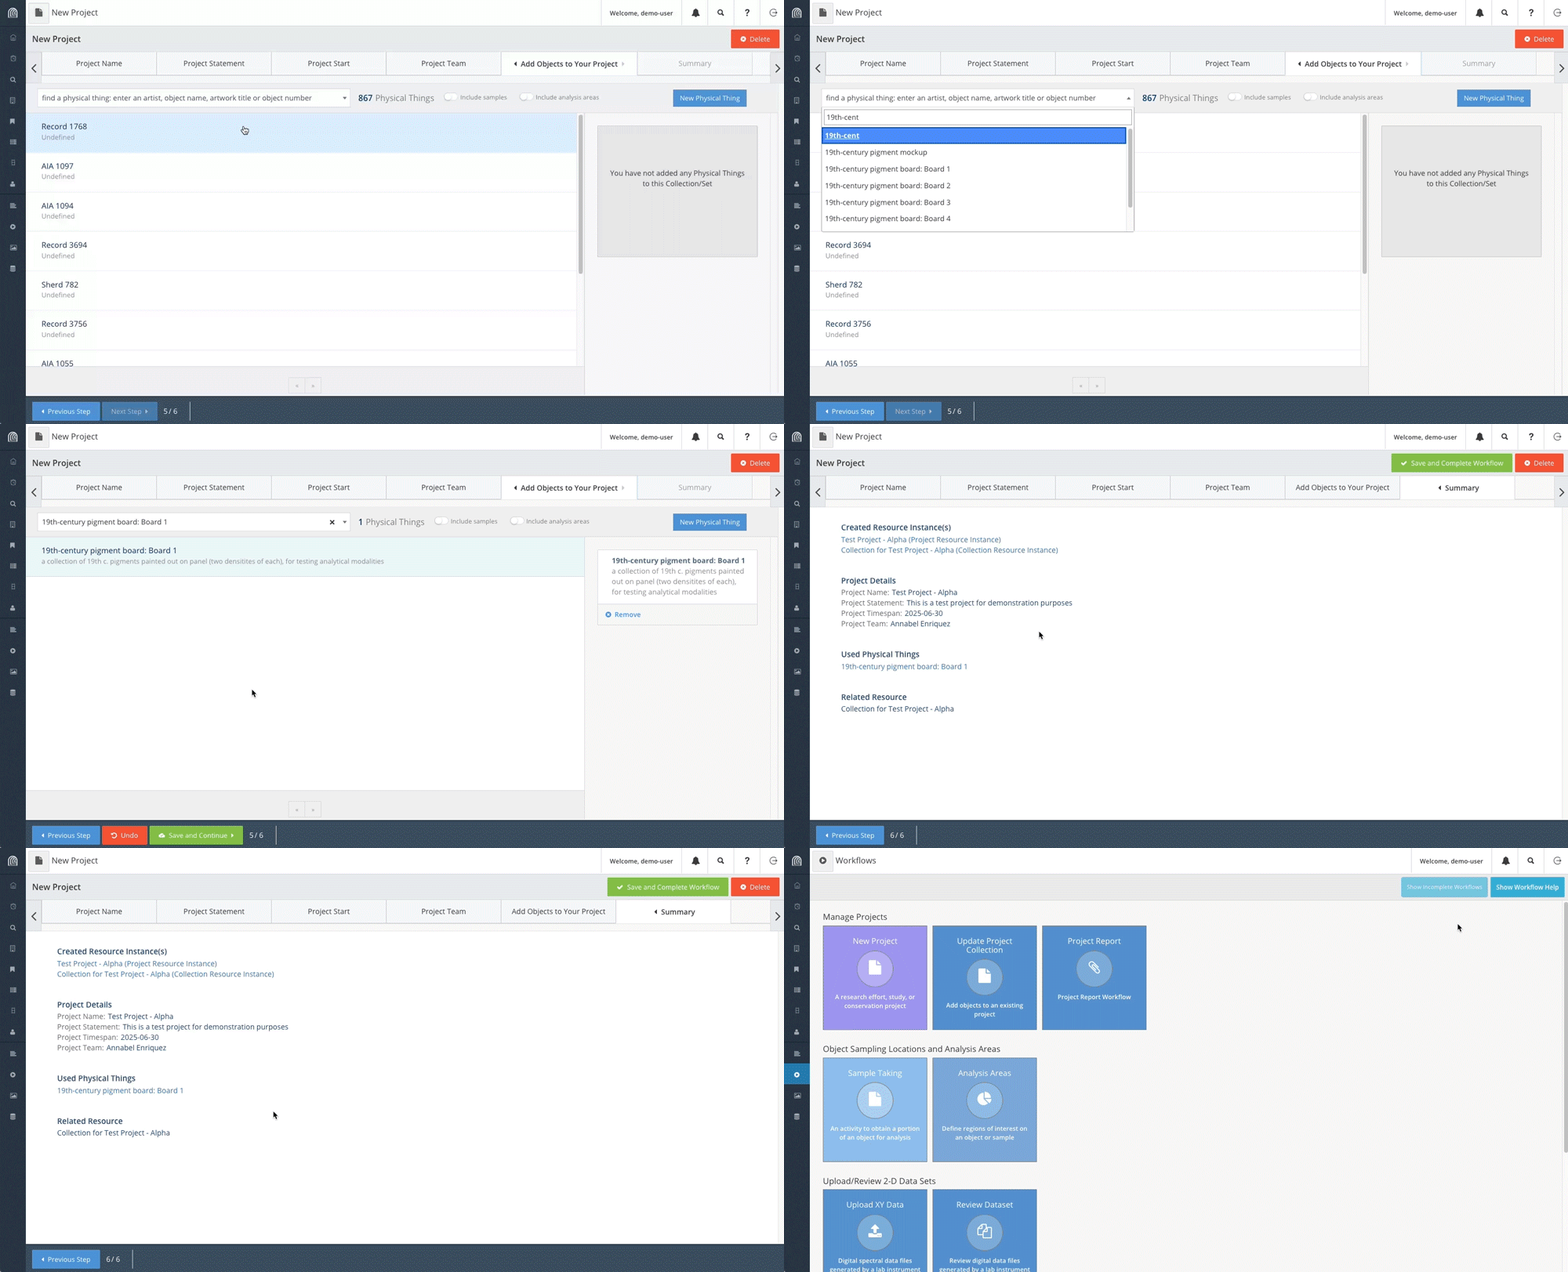
To create a record for a Project, click on the Workflows button and select New Project.
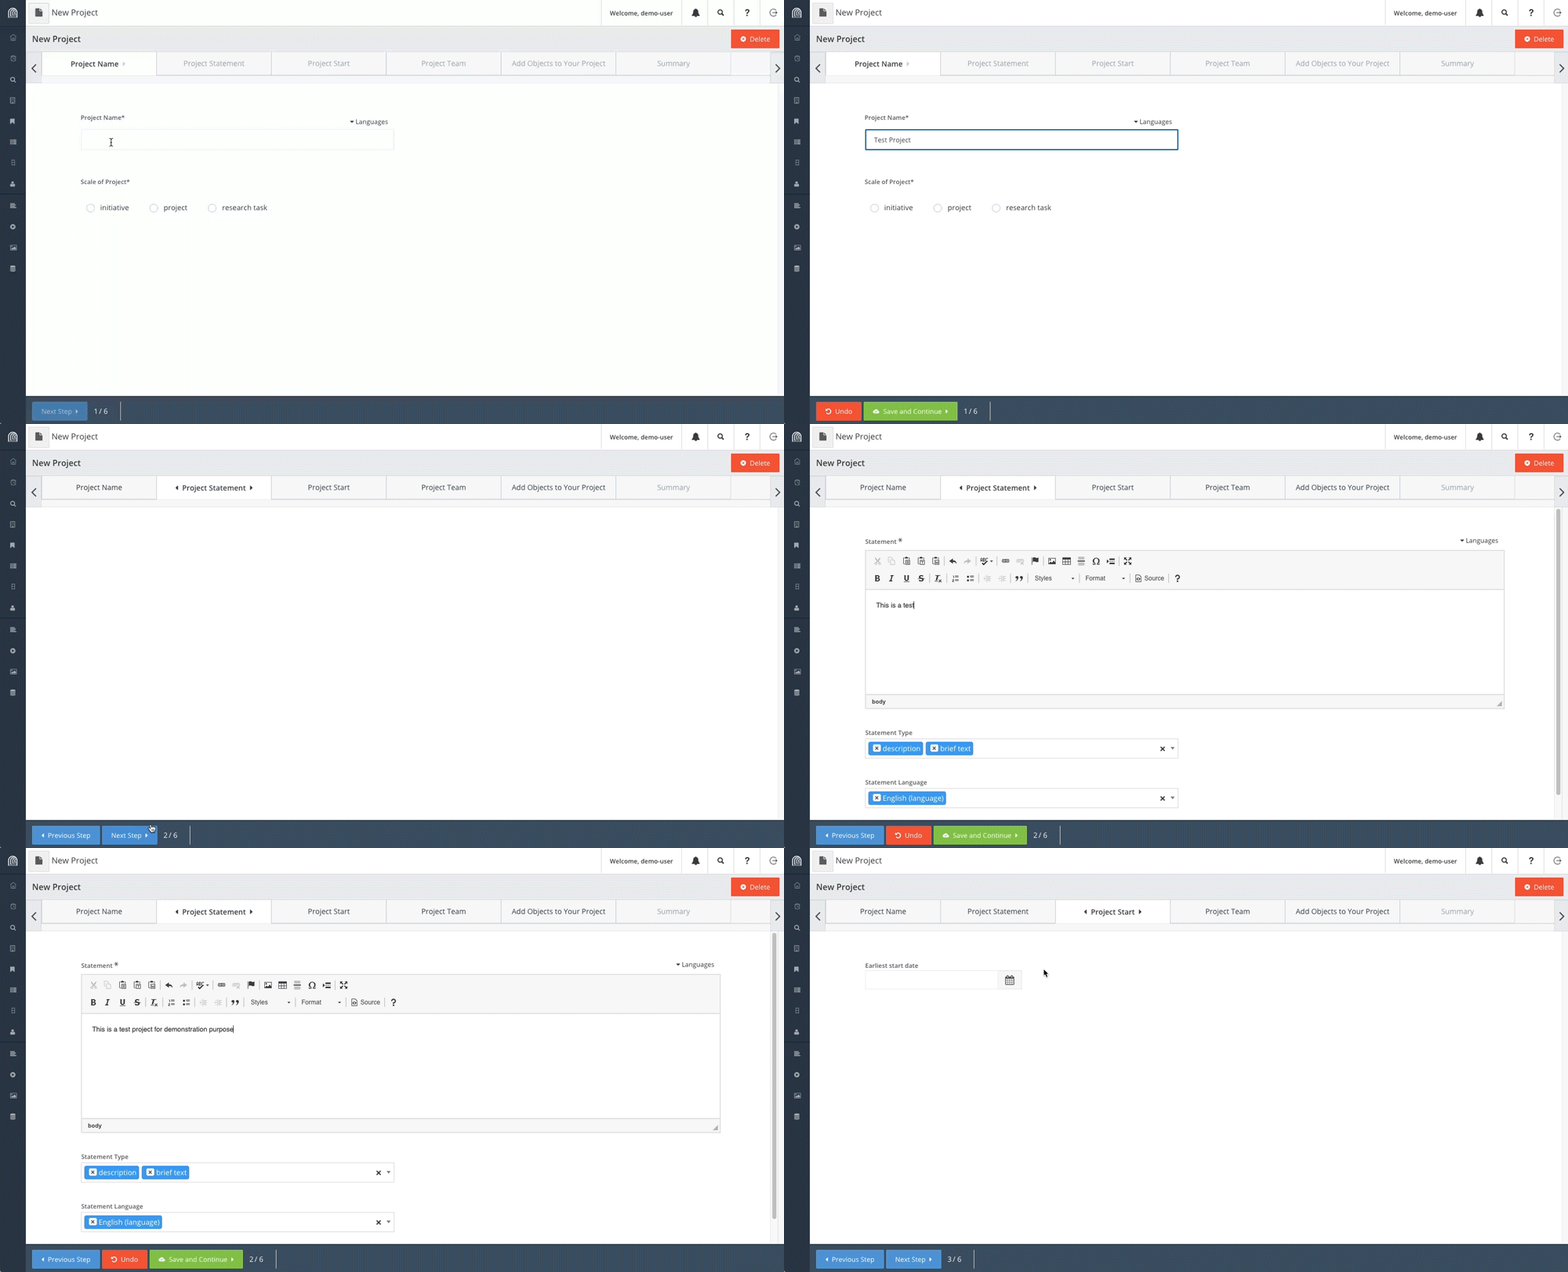
Follow the prompts for the first three tabs using the following data, being sure to click on Save and Continue after completing each tab:
- Project Name: “Test Project – [add an identifying word here to distinguish your project]” or another unique name. For the purpose of this example, we’ll use “Test Project – Alpha”.
- Scale of Project: Project
- Statement: “This is a test project for demonstration purposes.”
- Earliest Project Start Date: “2025-06-30”
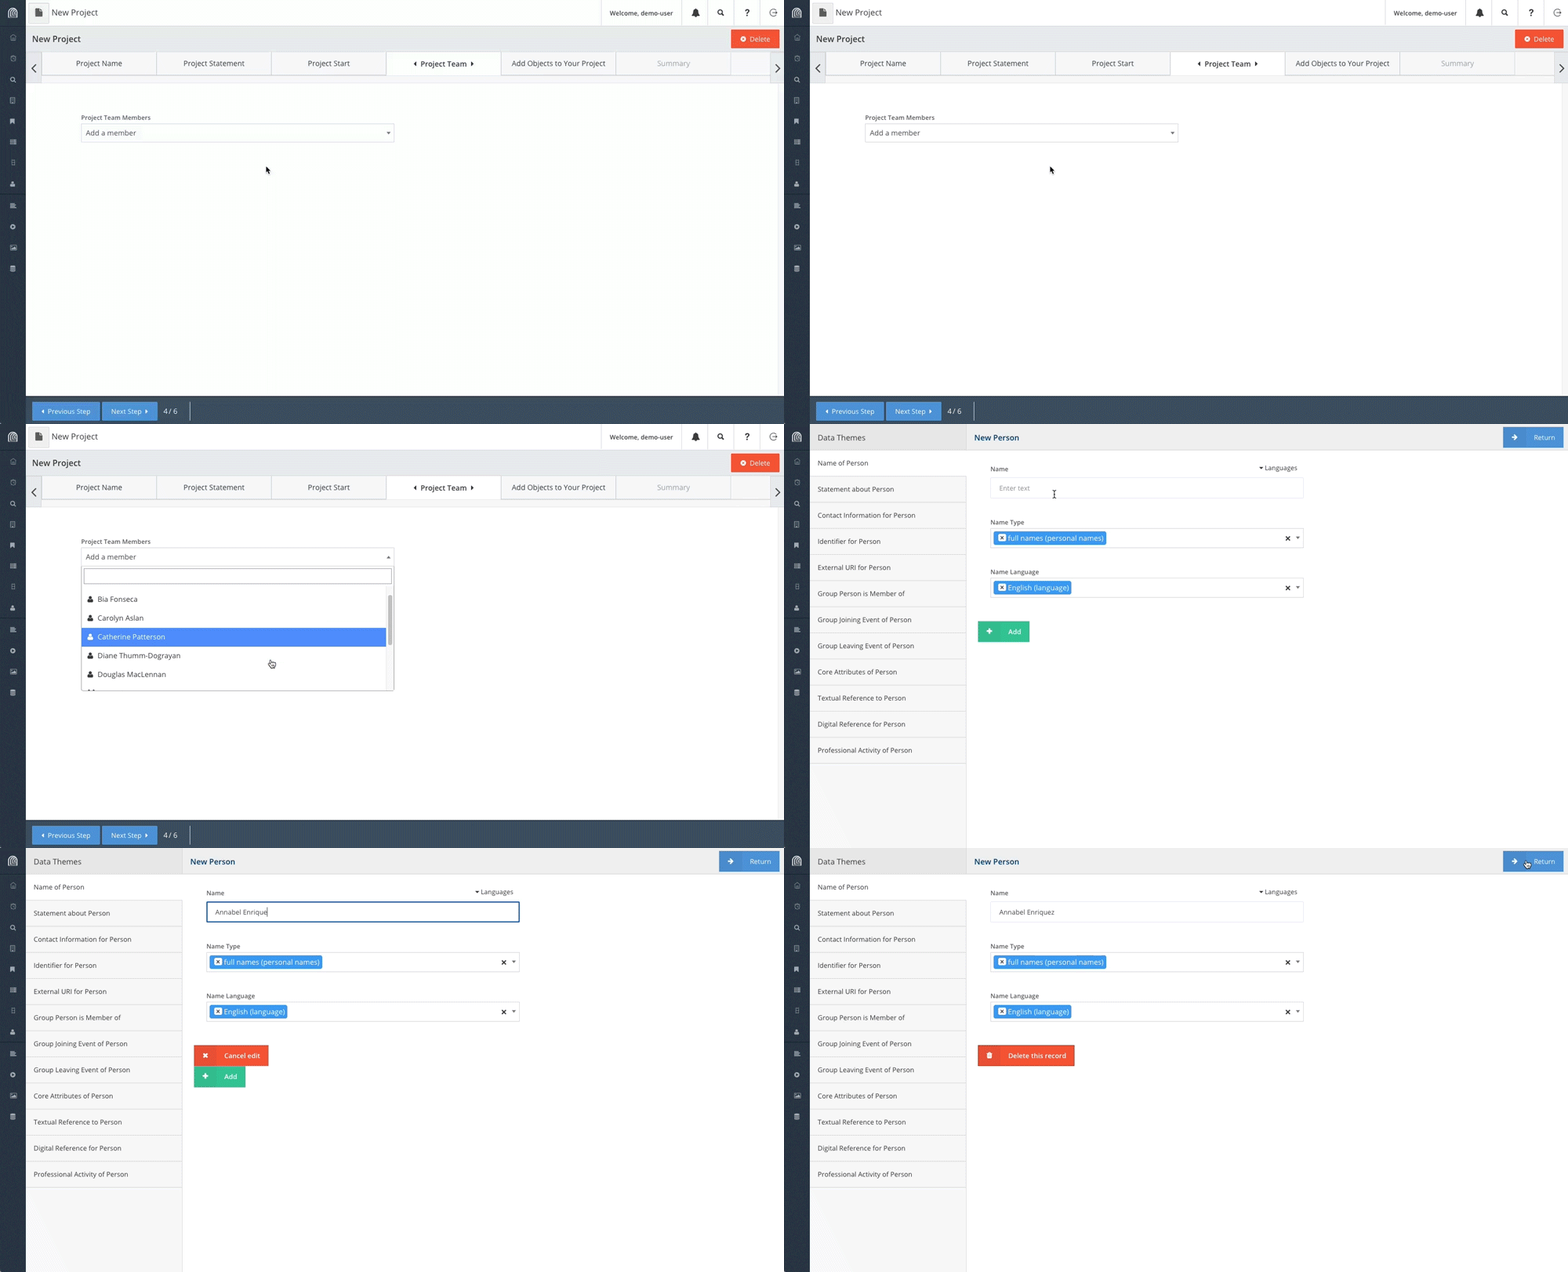
For the Project Team tab, select either an existing person from the dropdown list OR scroll to the bottom of the dropdown list and select Create a New Person. If you choose Create a New Person, in the interface that follows, enter the name of the person under Name, click Add, and then Return. In the Project Team tab, click on Save and Continue.
The next tab is Add Objects to Your Project. For this tutorial, select “19th-century pigment board: Board 1” by searching for this object and then clicking on the object until it appears in the right hand panel.
Click on Save and Continue to see the Summary tab. This shows all of the new data and resources that you have created as a result of this workflow. To save this workflow, click on Save and Complete Workflow in the top right corner.
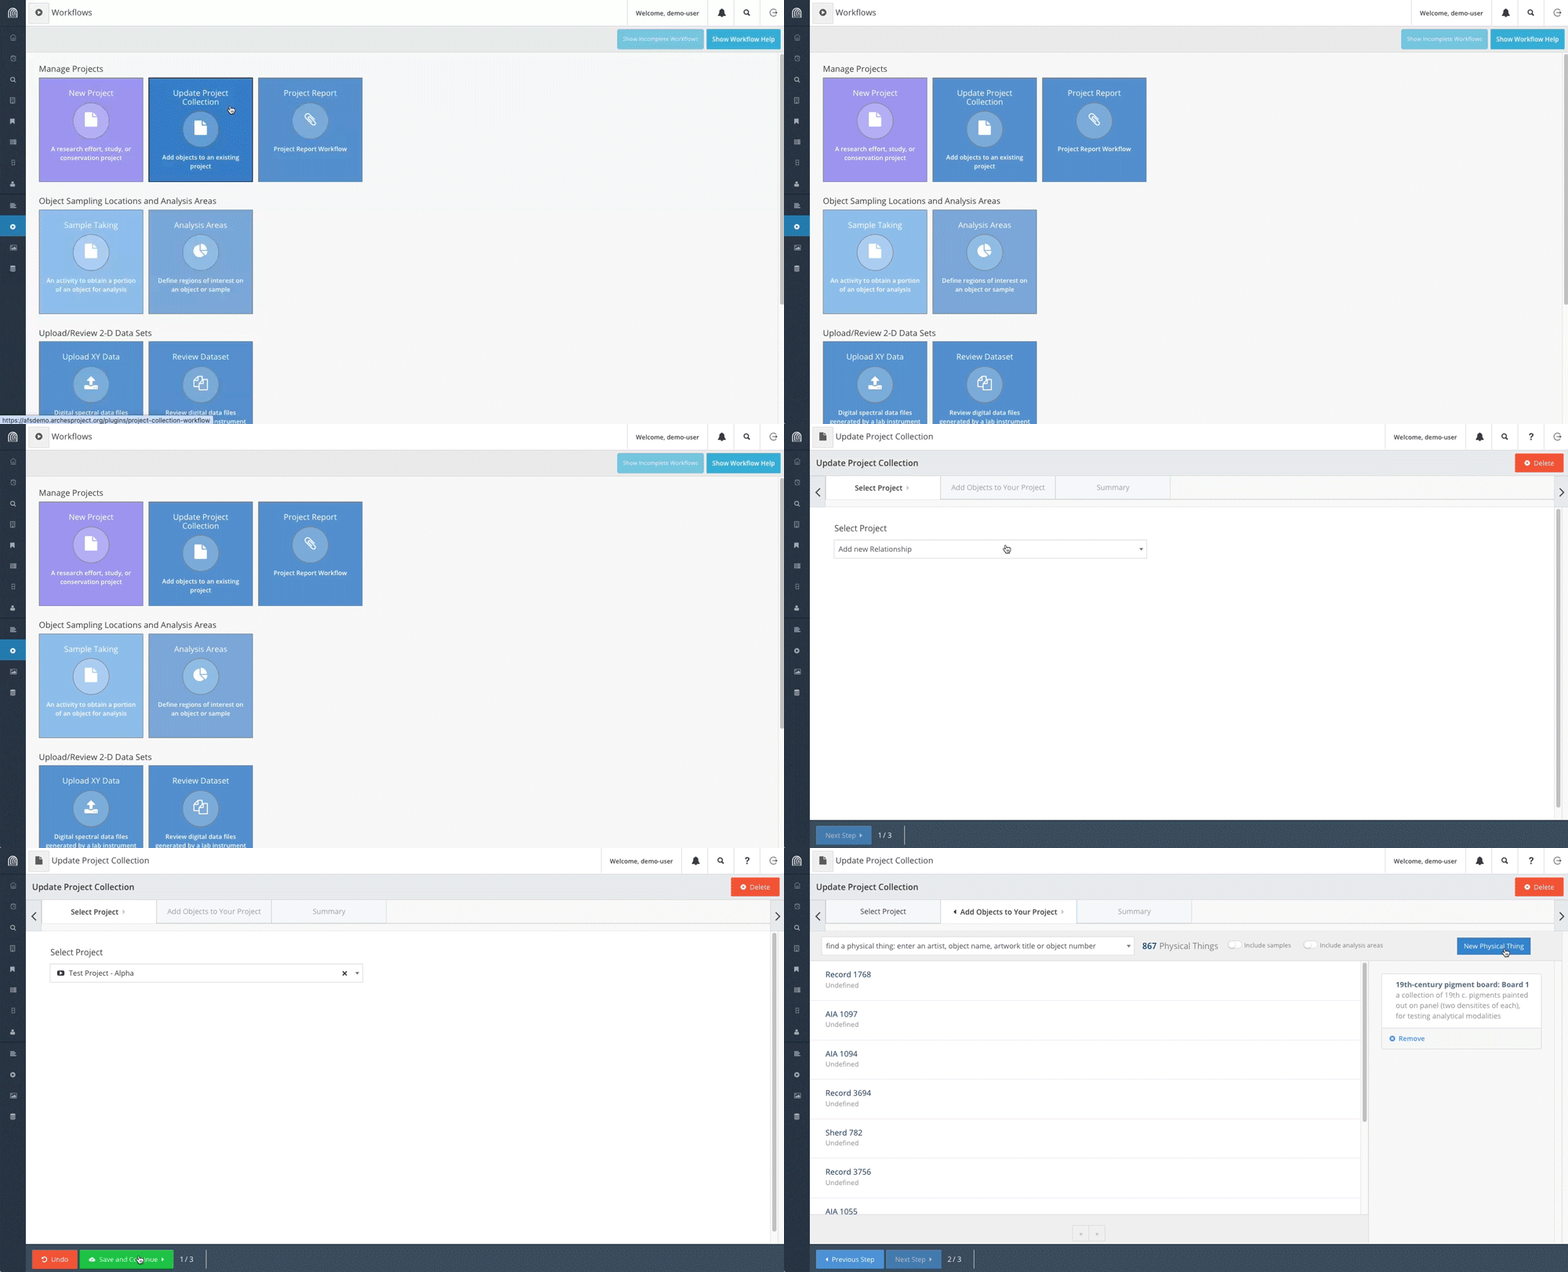
If after creating a new Project, you decide to add another Physical Thing, you can use the Update Project Collection workflow. You may remember that when you completed the New Project workflow, the summary showed a new Collection resource was created. Each Project has a corresponding Collection that contains all of the Physical Things that are part of that Project. This includes artworks, objects, samples taken from objects, and designated analysis areas of objects. As a result, the Update Project Collection workflow adds Physical Things to a Project by adding them to the corresponding Collection.
The Update Project Collection workflow interface is similar to what you have seen in the New Project workflow. To start, select the Project you created in the previous workflow. After clicking on Save and Continue, you’ll see the Add Objects to Your Project tab. However, instead of selecting an existing Physical Thing/Object, click on the button for New Physical Thing on the right.
In the New Physical Thing interface, select Name of Object in the left hand panel and type in a unique name for your object, such as “Test Object – [add unique name]”. For the tutorial’s example, the Name of the Object will be “Test Object – Alpha”. Click Add, then Return to return to the Add Objects to Your Project tab. Click on Save and Continue to see the Summary tab to confirm that you have two Physical Things listed and then click on Save and Complete Workflow.
Object Sampling Locations and Analysis Areas
This set of workflows capture information about sample taking and annotating analysis areas. A sample is removed from an object, whereas an analysis area is a part of an object that is used for study but is not removed.
For this tutorial, we will create a sample and then create an analysis area, building upon the New Project and Update Project Collection workflows.
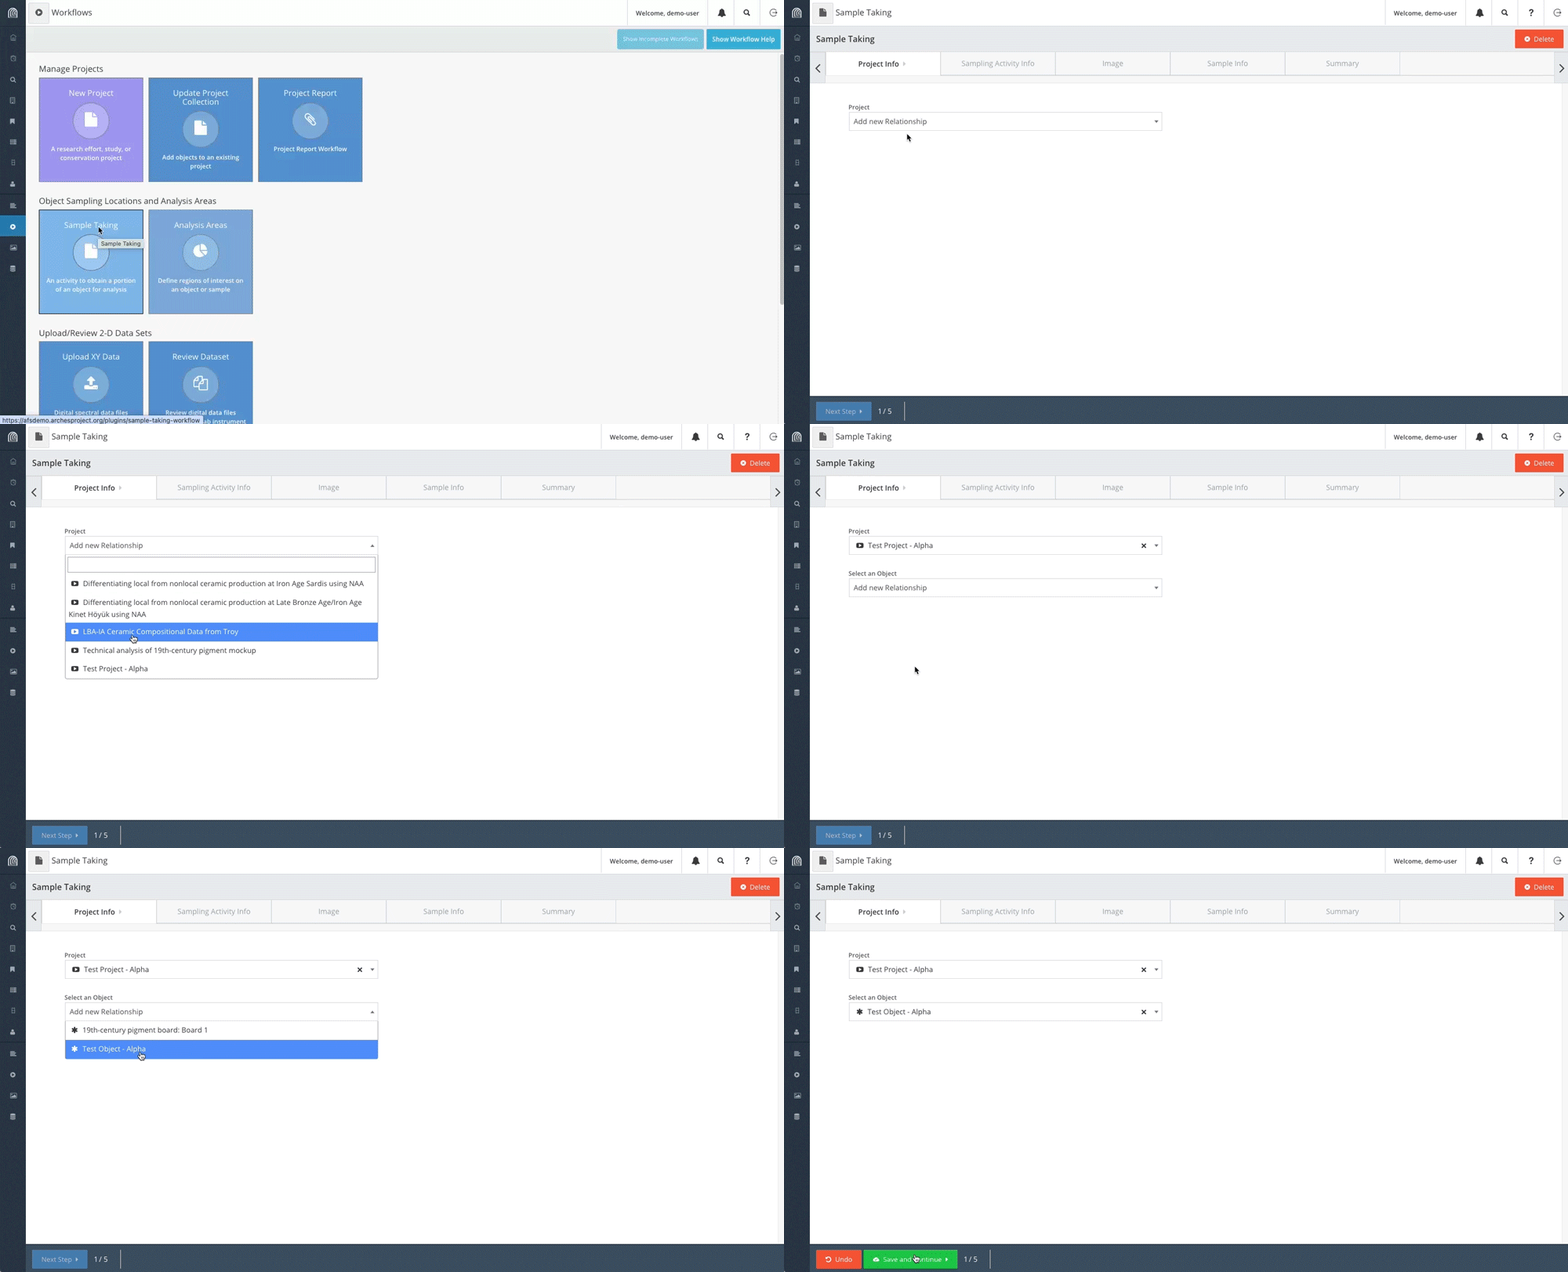
To start, navigate to the Sample Taking workflow.
In the Project Info tab, select the Project you created and the new Object that you created. In the tutorial example below, the Project is “Test Project – Alpha” and the Object is “Test Object – Alpha”. Click on Save and Continue.
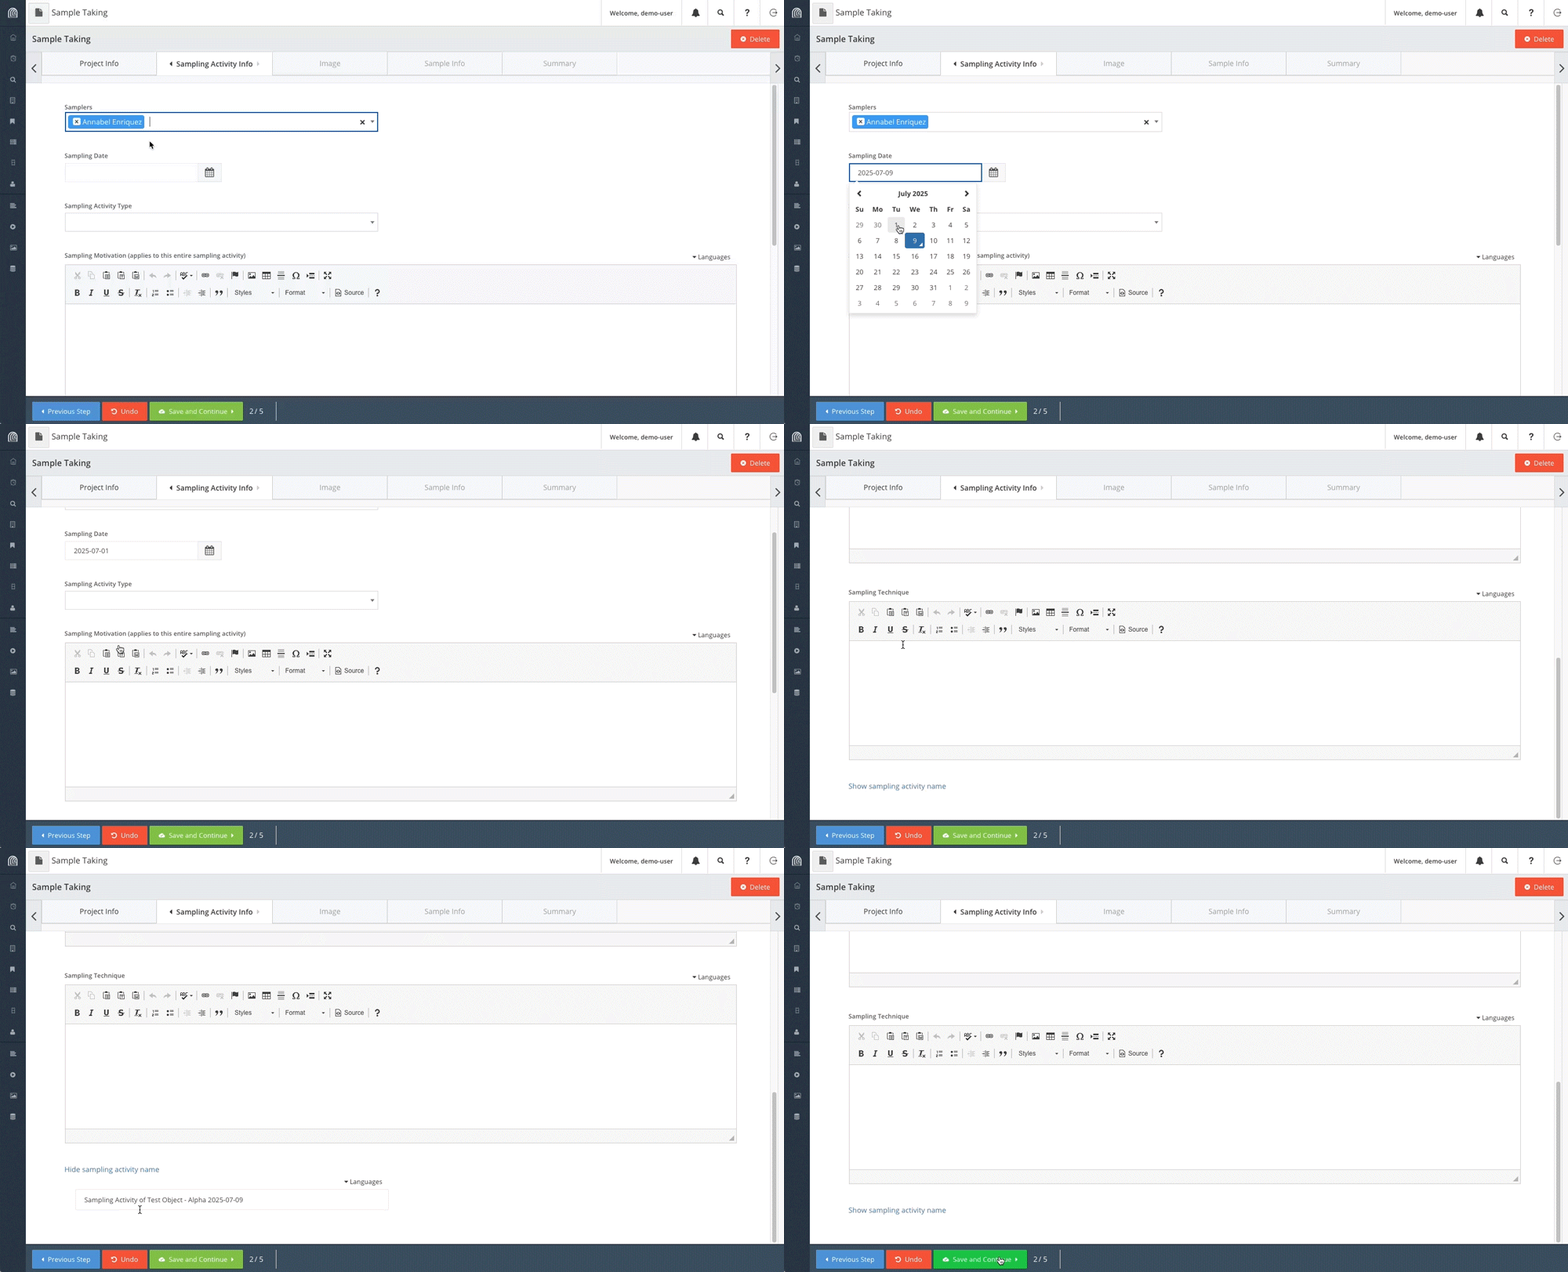
In the next tab Sampling Activity Info, enter the following information:
- Samplers: Select the same person that you selected or created in the New Project workflow.
- Sampling Date: 2025-07-01
The rest of the fields in this tab are optional for the tutorial, but here is a description of the fields:
- Sampling Activity Type: This field indicates whether the sample was obtained intentionally or unintentionally. As with all Arches dropdown fields, the dropdown options are customizable and can be added to by an administrator.
- Sampling Motivation: A text field that describes why the sampling took place.
- Sampling Technique: A text field that describes how the sample was taken.
- At the bottom of the tab is a link to Show sampling activity name. Clicking on this will show the name of the Sampling Activity resource instance that will be created. The automatically generated name includes the object name and the sampling date. The name can be edited here, if necessary.
Once you have entered the information for this tab, click on Save and Continue.
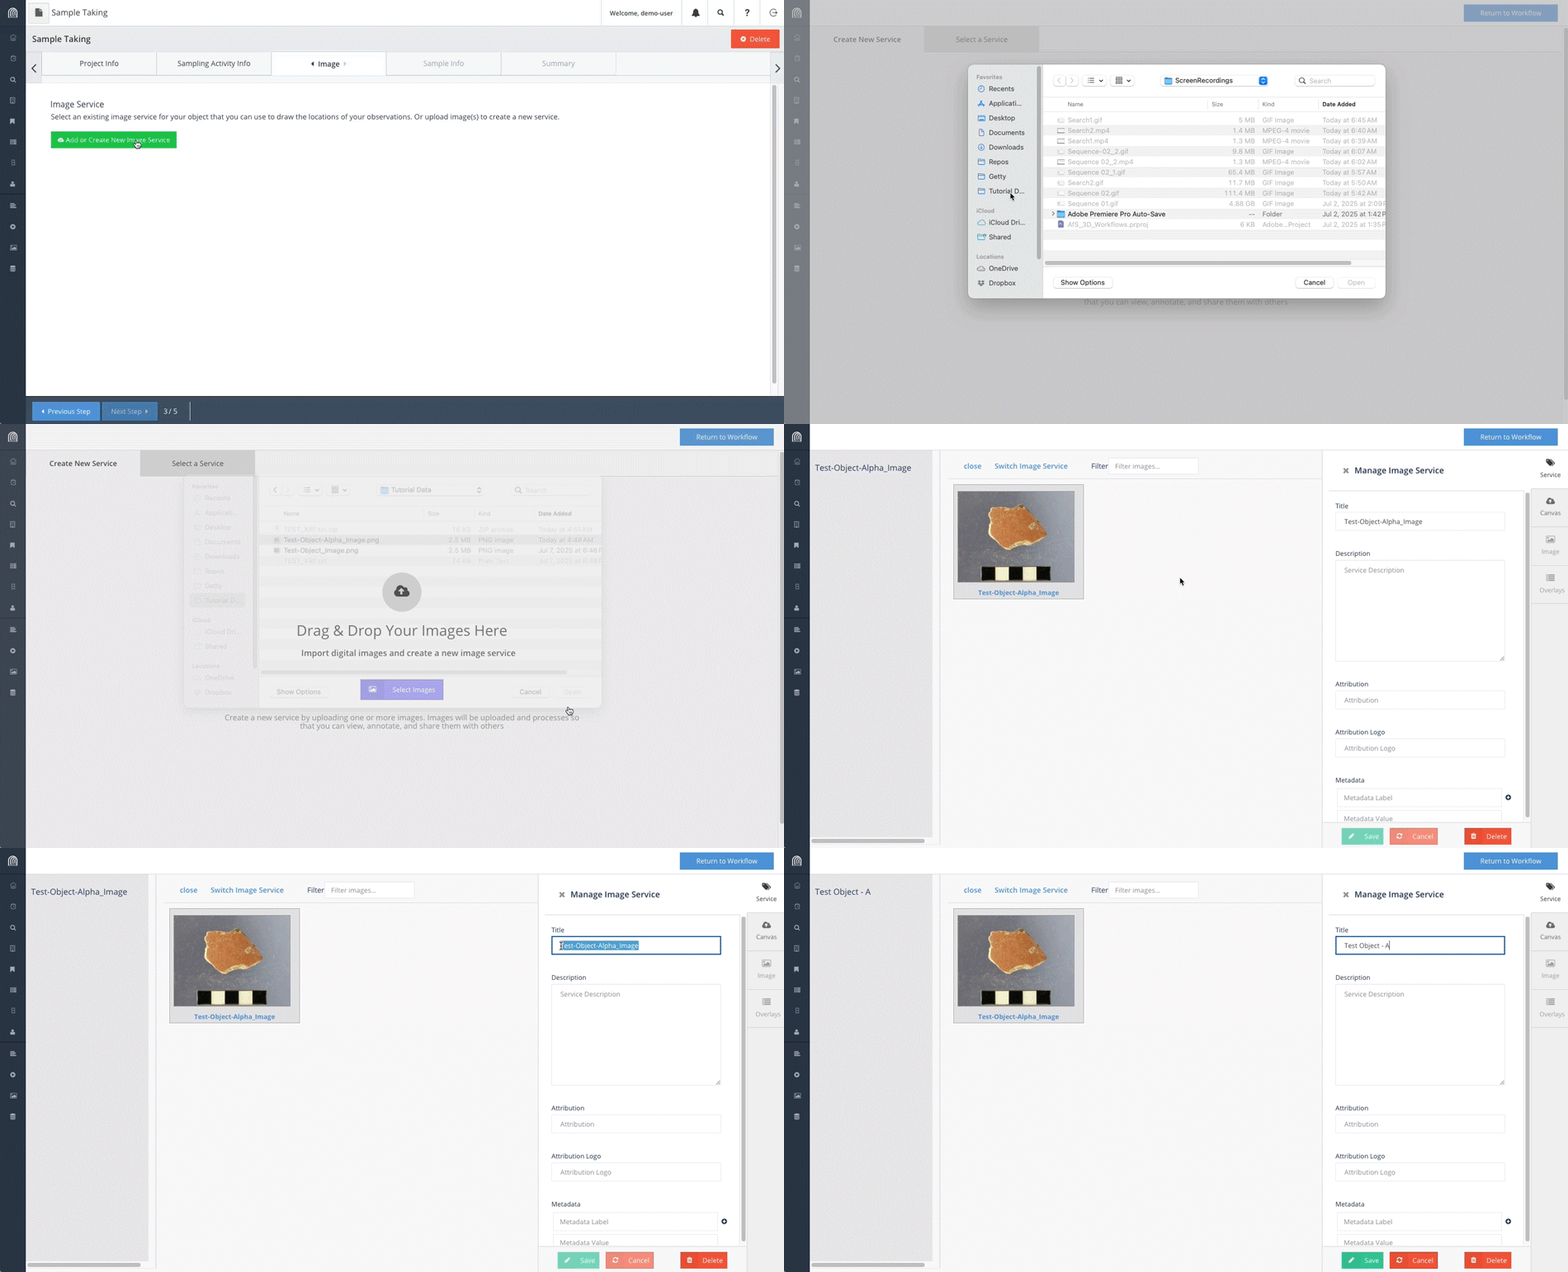
Next, the Image tab gives us the opportunity to create a new image service. At this point, download the image Test-Object_Image.png) that we’ll use for “Test Object – Alpha” or whatever you named the new Physical Thing that you created. Be sure to rename the image as “Test-Object-[add unique name]_Image.png”. For the tutorial example, the image name will be “Test-Object-Alpha_Image.png”.
Once you’ve saved the image in a known directory, click on the Add or Create New Image Service button. Under Drag & Drop Your Images Here, click on Select Images. Navigate to the image file, select it and click Open.
Once the image has been uploaded and added as a canvas within a new image service, name the image service as follows: “[Object name] Images”. For example, the image service name in the example below is “Test Object – Alpha Images”.
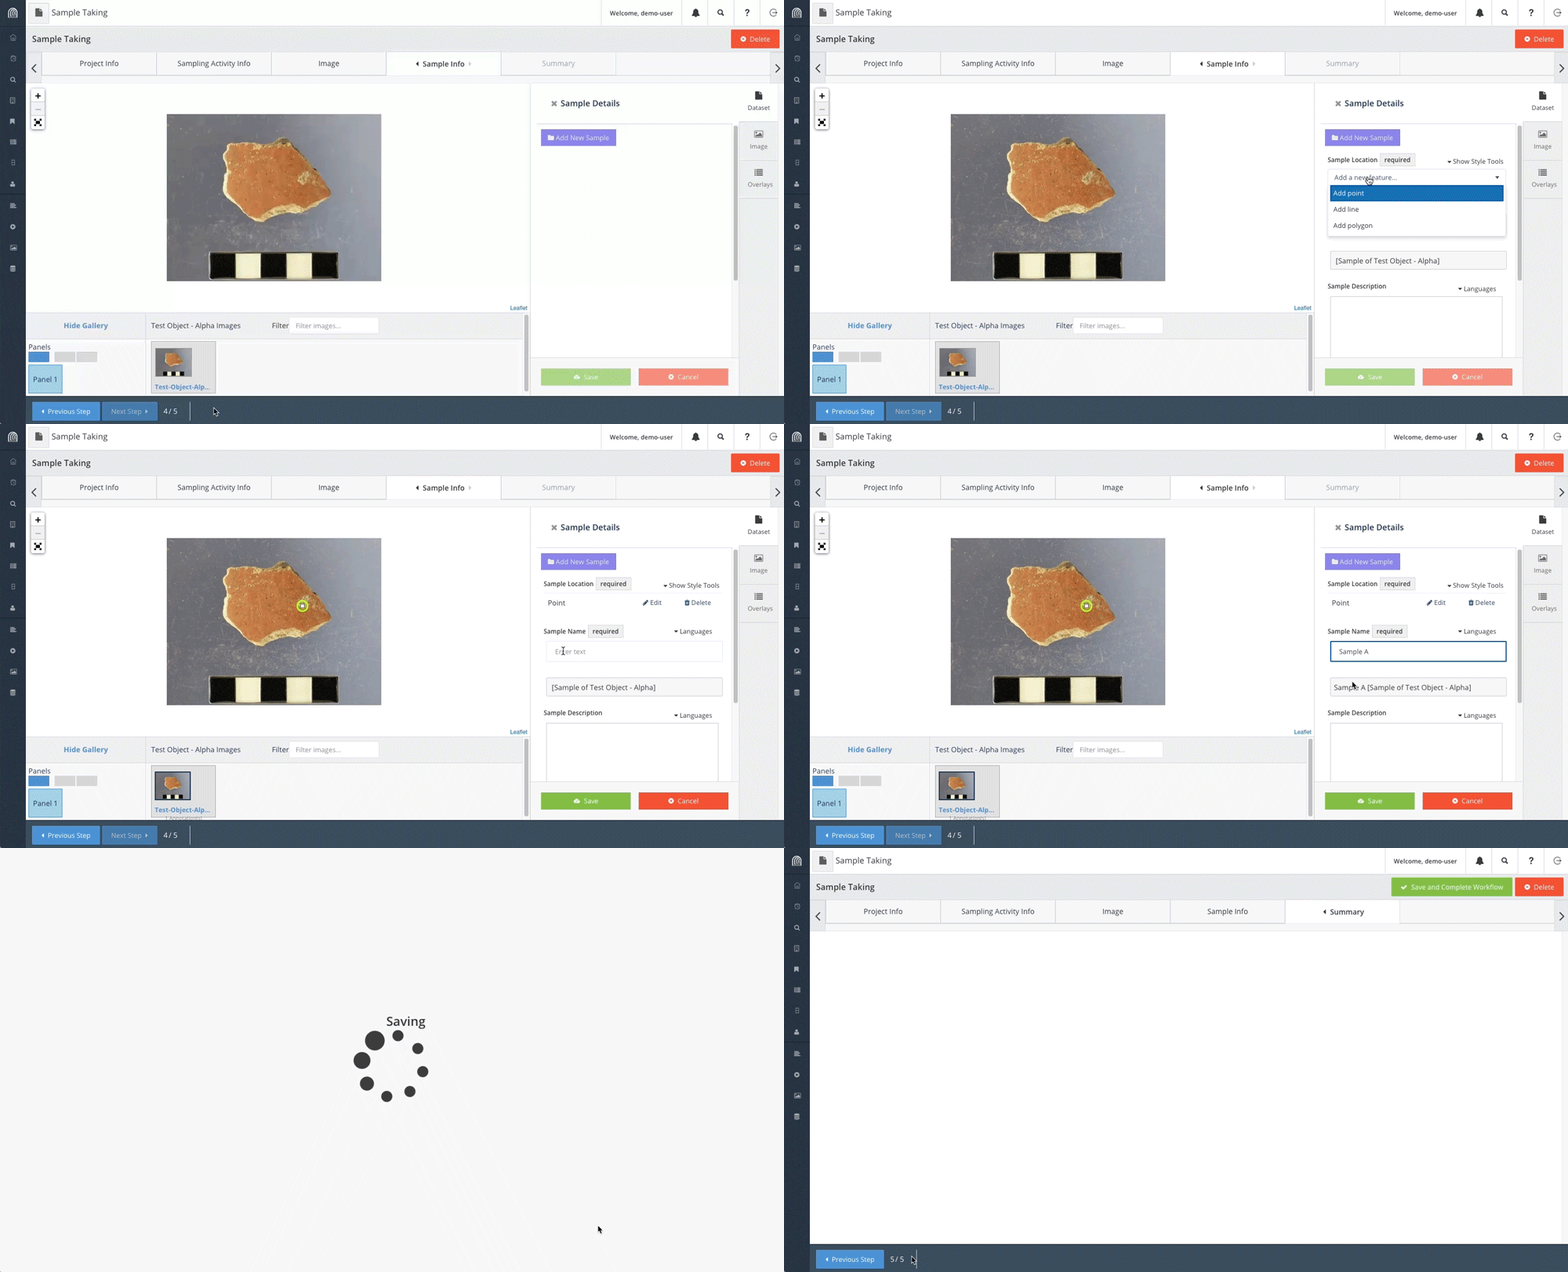
The next tab Sample Info is where we will annotate the object image with the location of where a sample was taken. Under Select an image service, select the image service that was just created, such as “Test Object – Alpha Images”, and click Load image service.
To add a new sample location, click on the Add New Sample button. Under Sampling Location, select Add point in the dropdown list and draw a point on the object. Once you’ve drawn the point, under Sample Name, enter “Sample A”. Automatically, “Sample A” is added to the full name of the sample: “Sample A [Sample of Test Object – Alpha]”
The Sample Description and Motivation for taking this sample fields are not required, so you can move on by clicking on the Save button. Since we are only adding one sample, click on Next Step on the bottom of the workflow to see the summary. After viewing the Summary tab, click on Save and Complete Workflow.
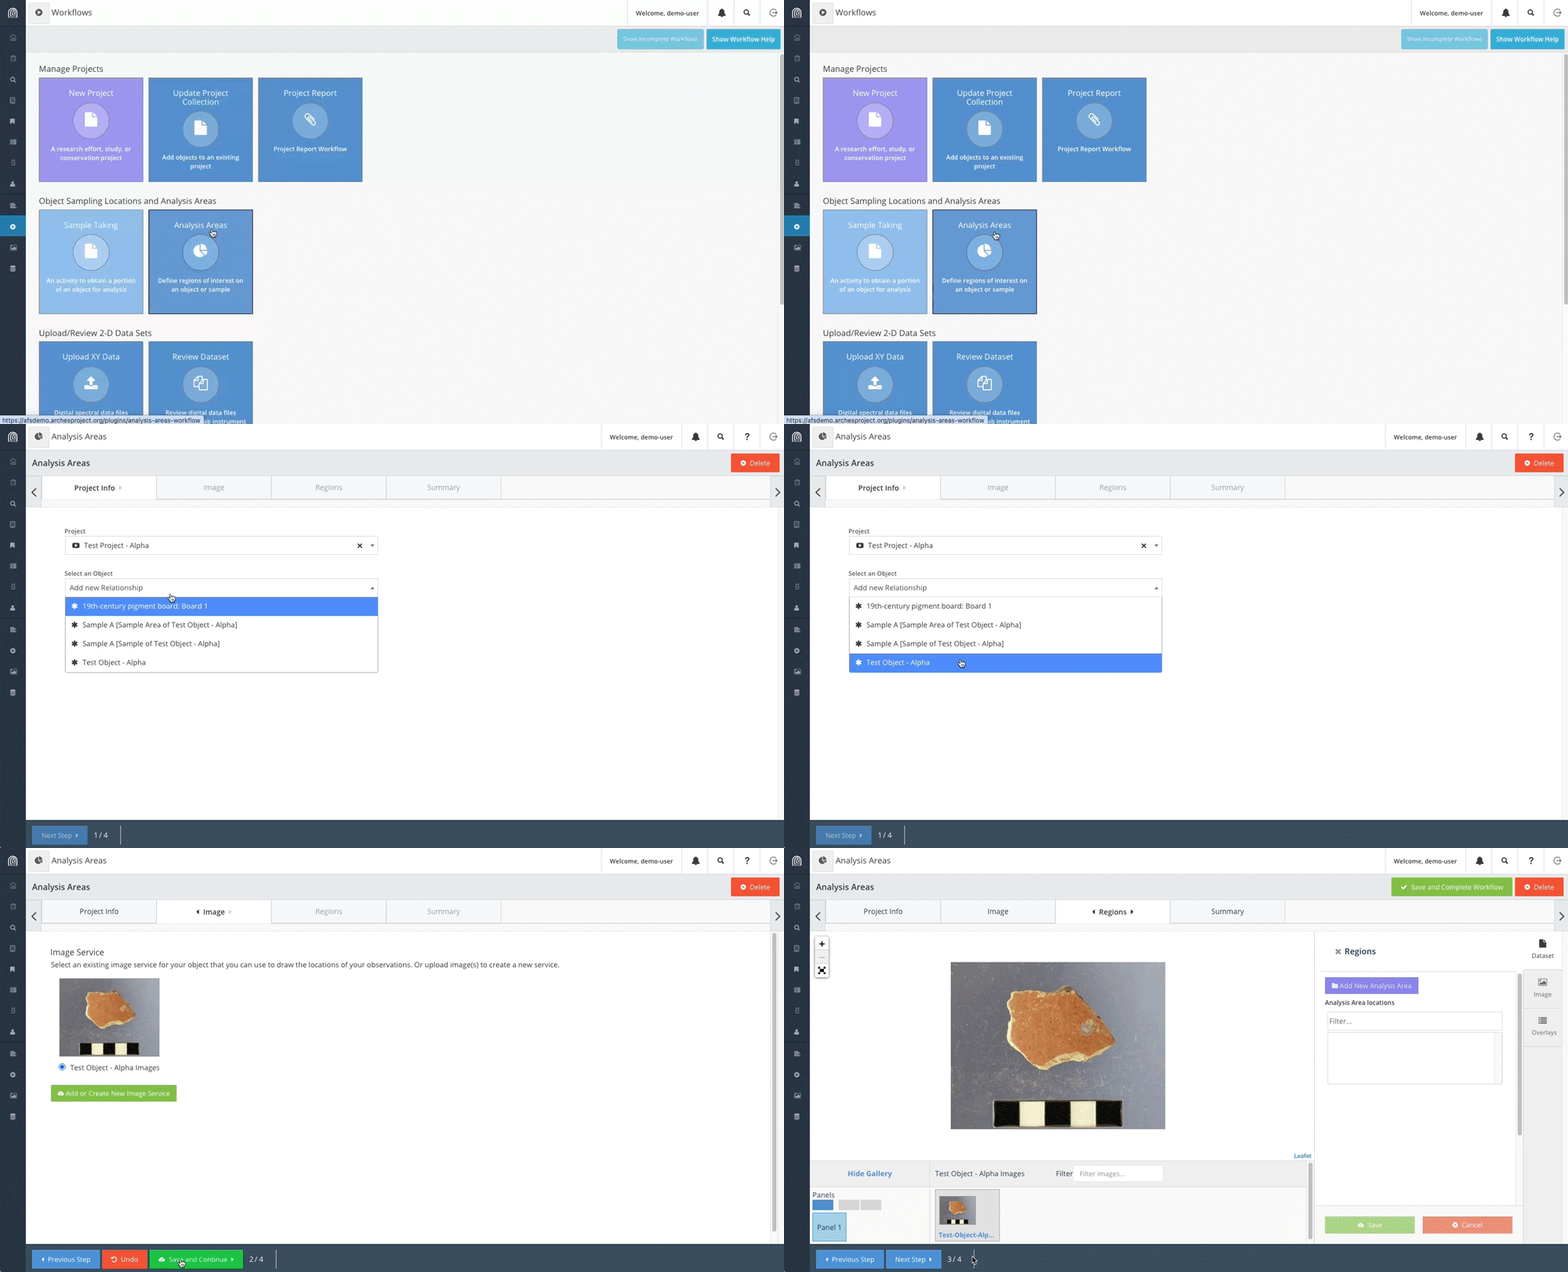
The Analysis Areas workflow is similar to the Sample Taking workflow, but behind the scenes, different data is being created. For example, creating an analysis area does not create a Sampling Activity instance. Also, it is possible to create analysis areas on a sample, but in this tutorial, we will only be creating an analysis area on the original object.
To start, click on the Analysis Areas button and enter the same Project and Object that you used for the Sample Taking workflow.
The same image service that you used for the Sample Taking workflow should appear when progressing to the Image tab, and you can continue on to the next step.
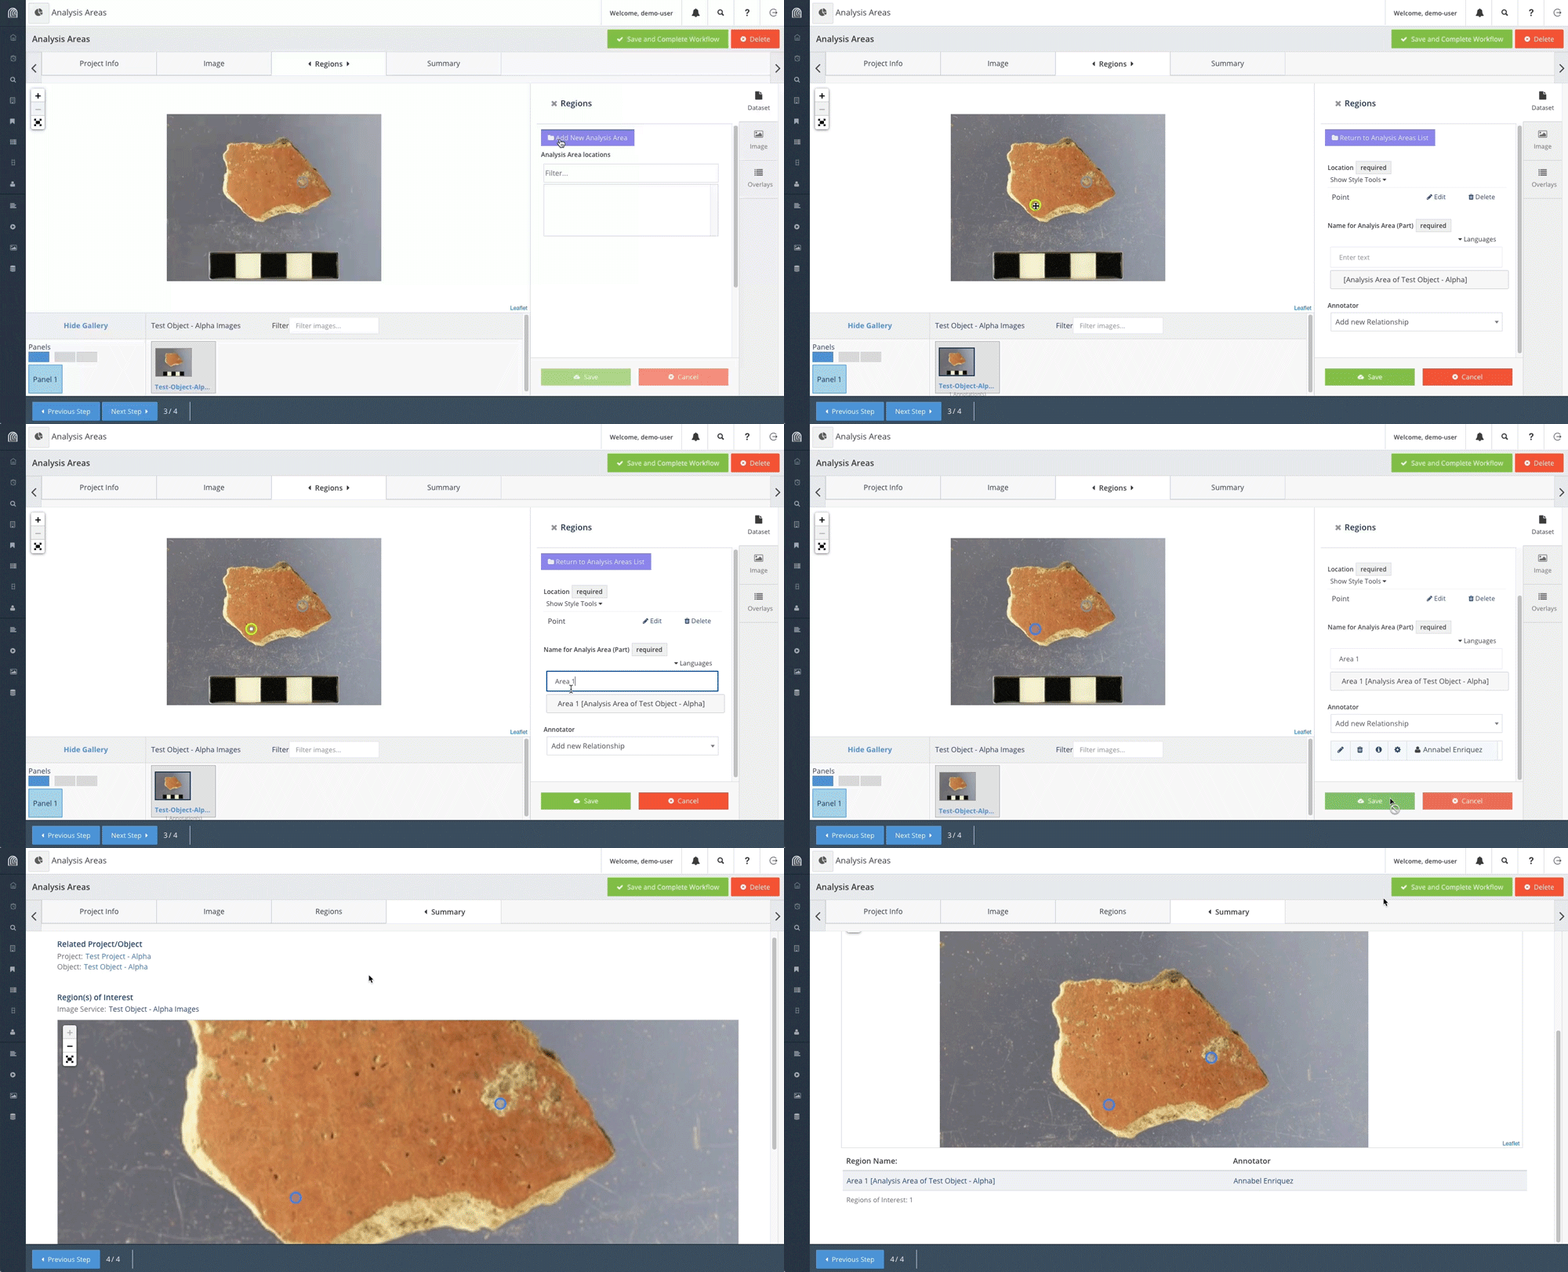
Under the Regions tab, once you’ve reselected the image service and loaded it, you can click Add New Analysis Area. Under Location, select Add point and draw a point anywhere on the object. Under Name, enter “Area 1”, which will automatically be added to the full name of the area: “Area 1 [Analysis Area of Test Object – Alpha]”. Select the person you originally added to the Project as an Annotator and click Save.
Click on Next Step to view the Summary tab and then Save and Complete Workflow.
Upload/Review 2-D Data Sets
Once we have defined a Project, associated Physical Things/Objects with it, and defined Samples and Analysis Areas, we can upload datasets that correspond to Analysis Areas.
DATA NEEDED: Before starting, download “TEST_XRF.txt” and save it to a known directory location.
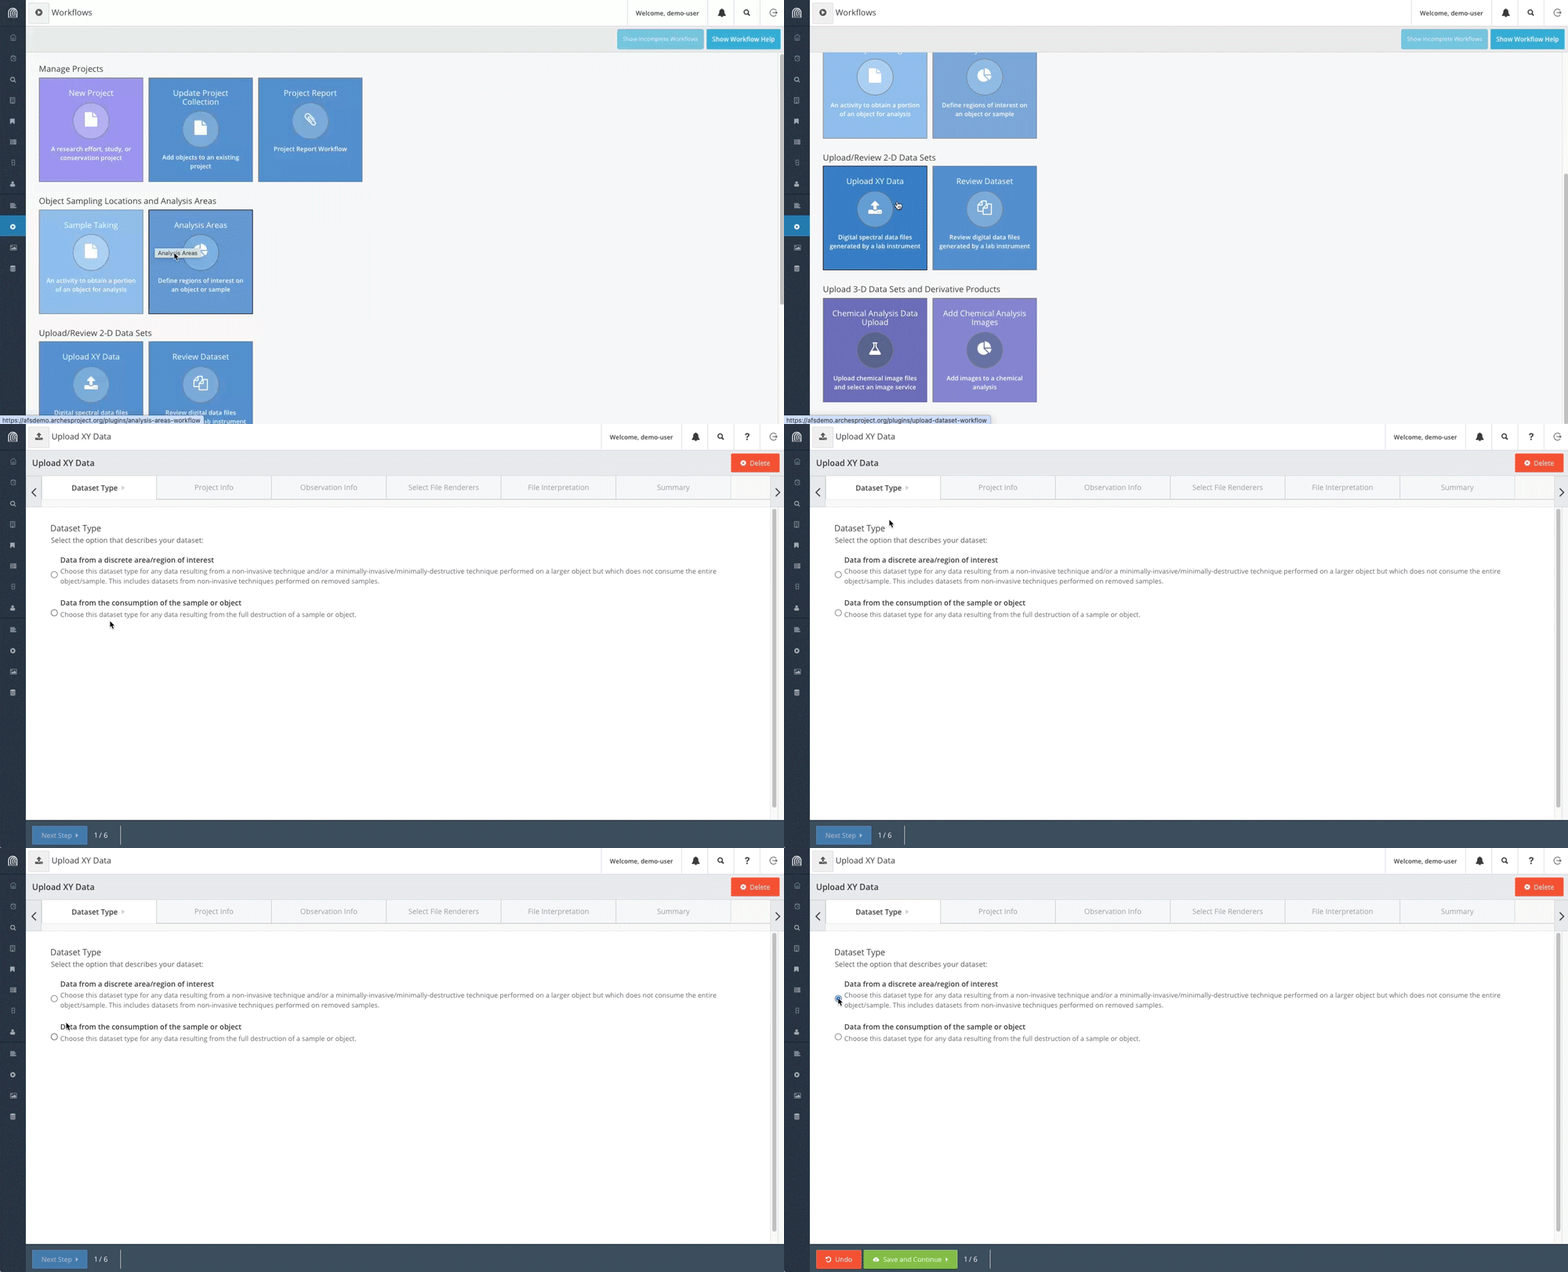
After selecting the Upload XY Data workflow button, the first tab Dataset Type requires an indication to whether the data resulted from a non-destructive process or from a process in which a sample or object was consumed or destroyed. This choice determines whether information will be added that refers to the actual destruction of the sample or object. For this tutorial, select “Data from a discrete area/region of interest” and click on Save and Continue.
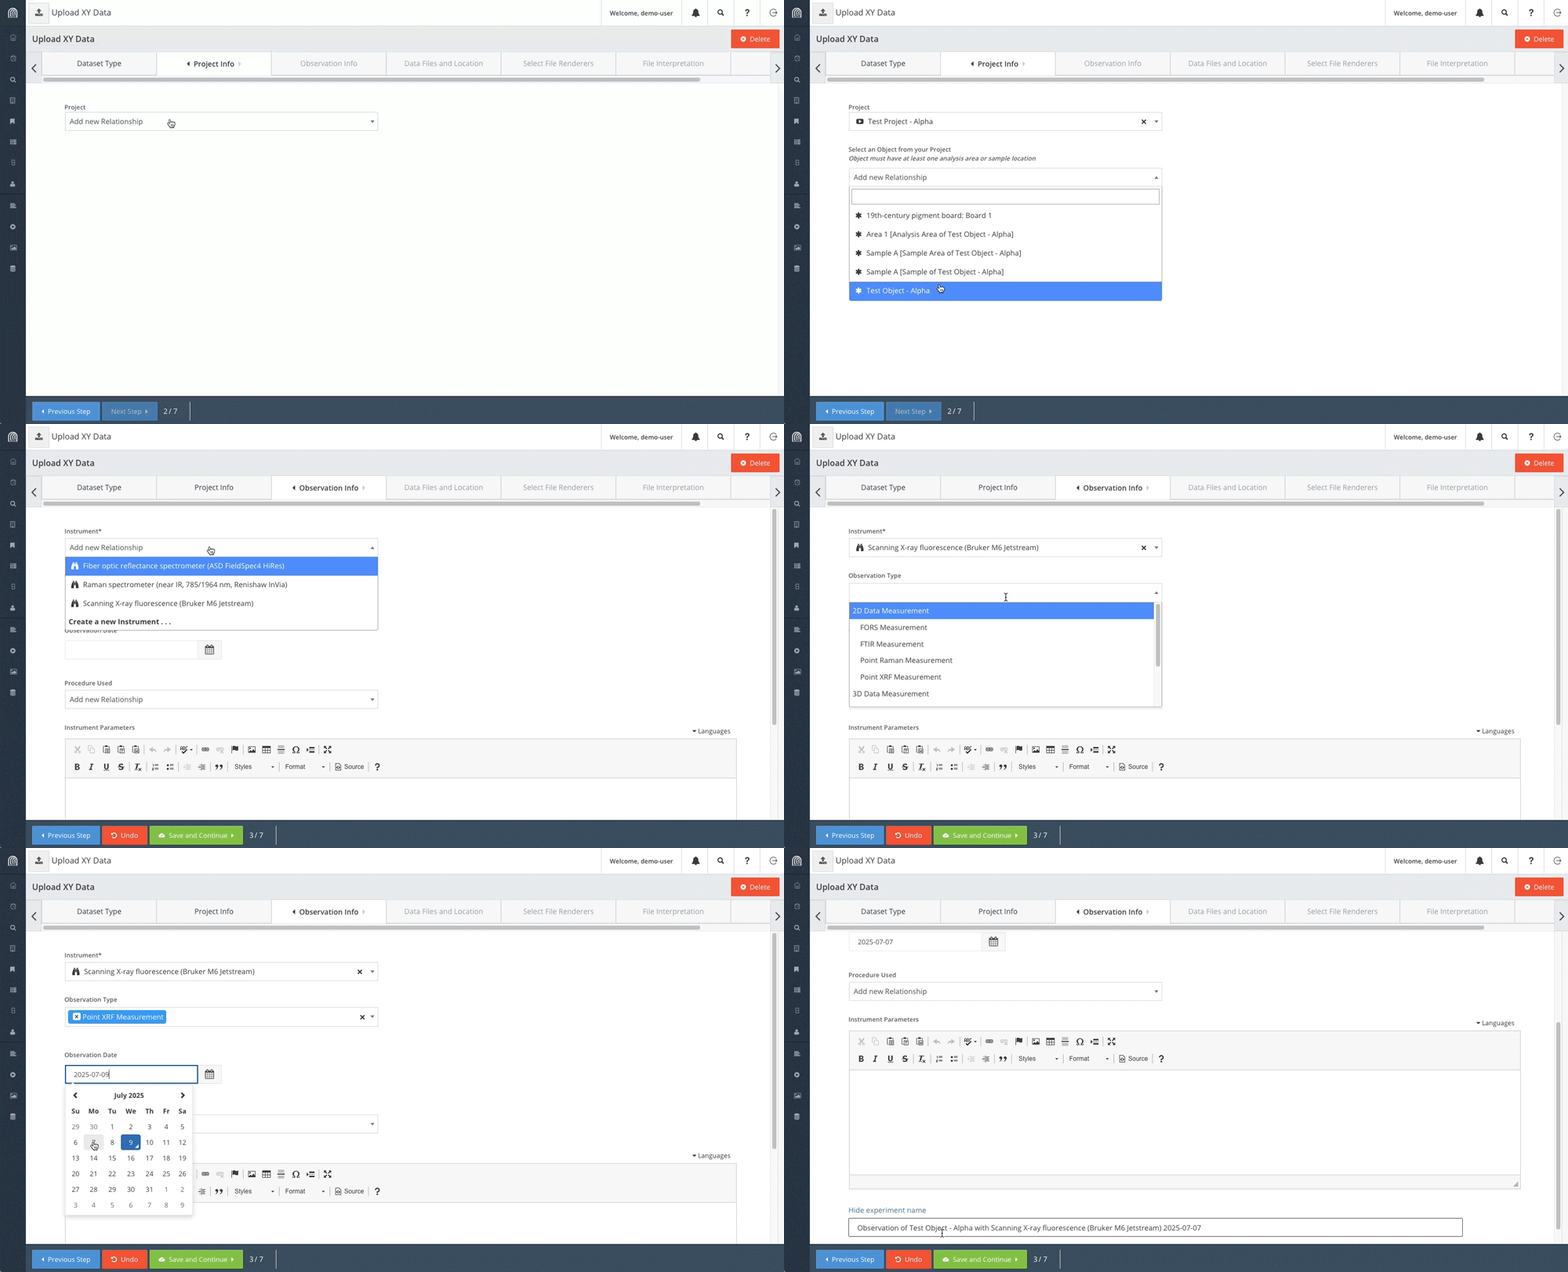
In the Project Info tab, select the same Project and Object that we used for the Analysis Areas workflow. Click on Save and Continue.
In the Observation Info tab, select “Scanning X-ray fluorescence (Bruker M6 Jetstream)” under Instrument. Select “Point XRF Measurement” under Observation Type and select any date under Observation Date.
We will not be entering information under Procedure Used or Instrument Parameters for the tutorial. Note that the Procedure Used field can be used to link to a document that describes a particular procedure and Instrument Parameters can be used to describe any settings that were used to create the dataset on the whole.
Scrolling to the bottom, click on Show experiment name to see the name of the Observation instance that will be created through this workflow. Click Next Step.
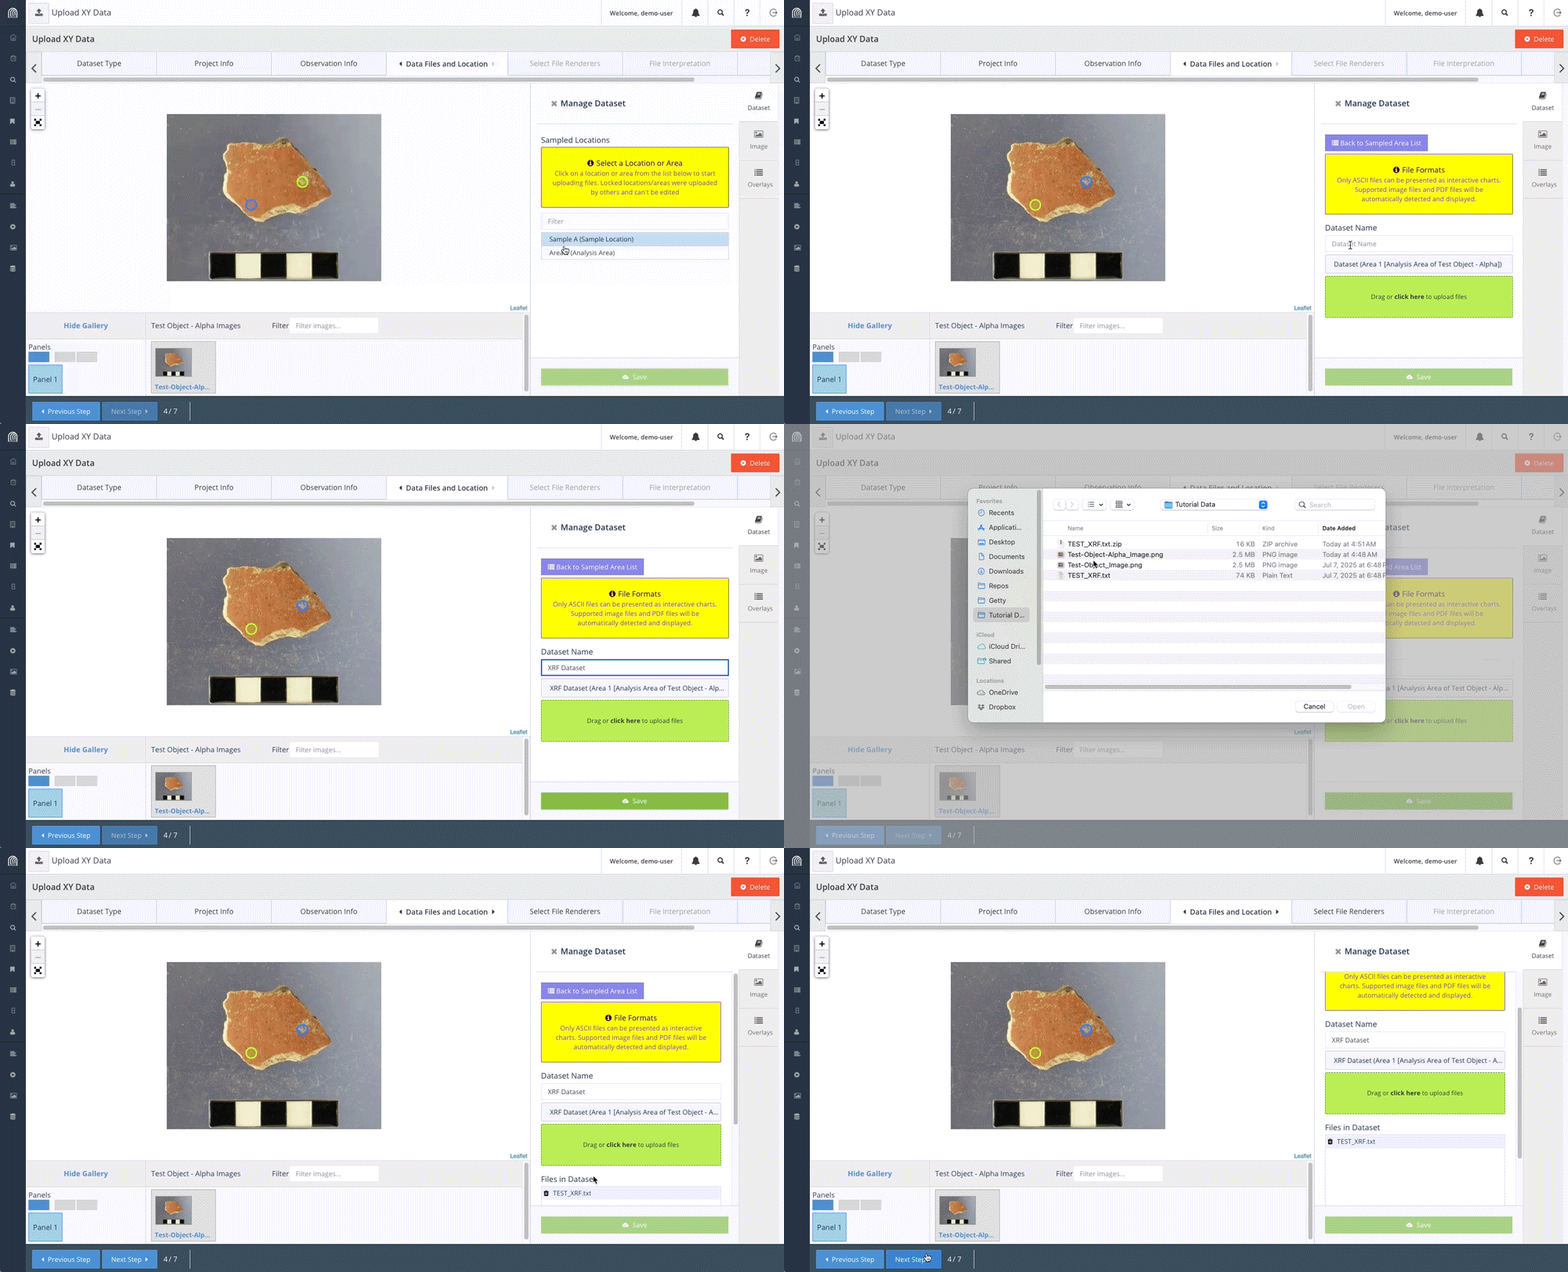
In the Data Files and Location tab, the Analysis Area that was created previously should be visible in the right hand panel under Sampled Locations. Click on the listing and then type “XRF Dataset” under Dataset Name. Click on the green box that is labeled Drag or click here to upload files and find and select “TEST_XRF.txt”. Click on Next Step.
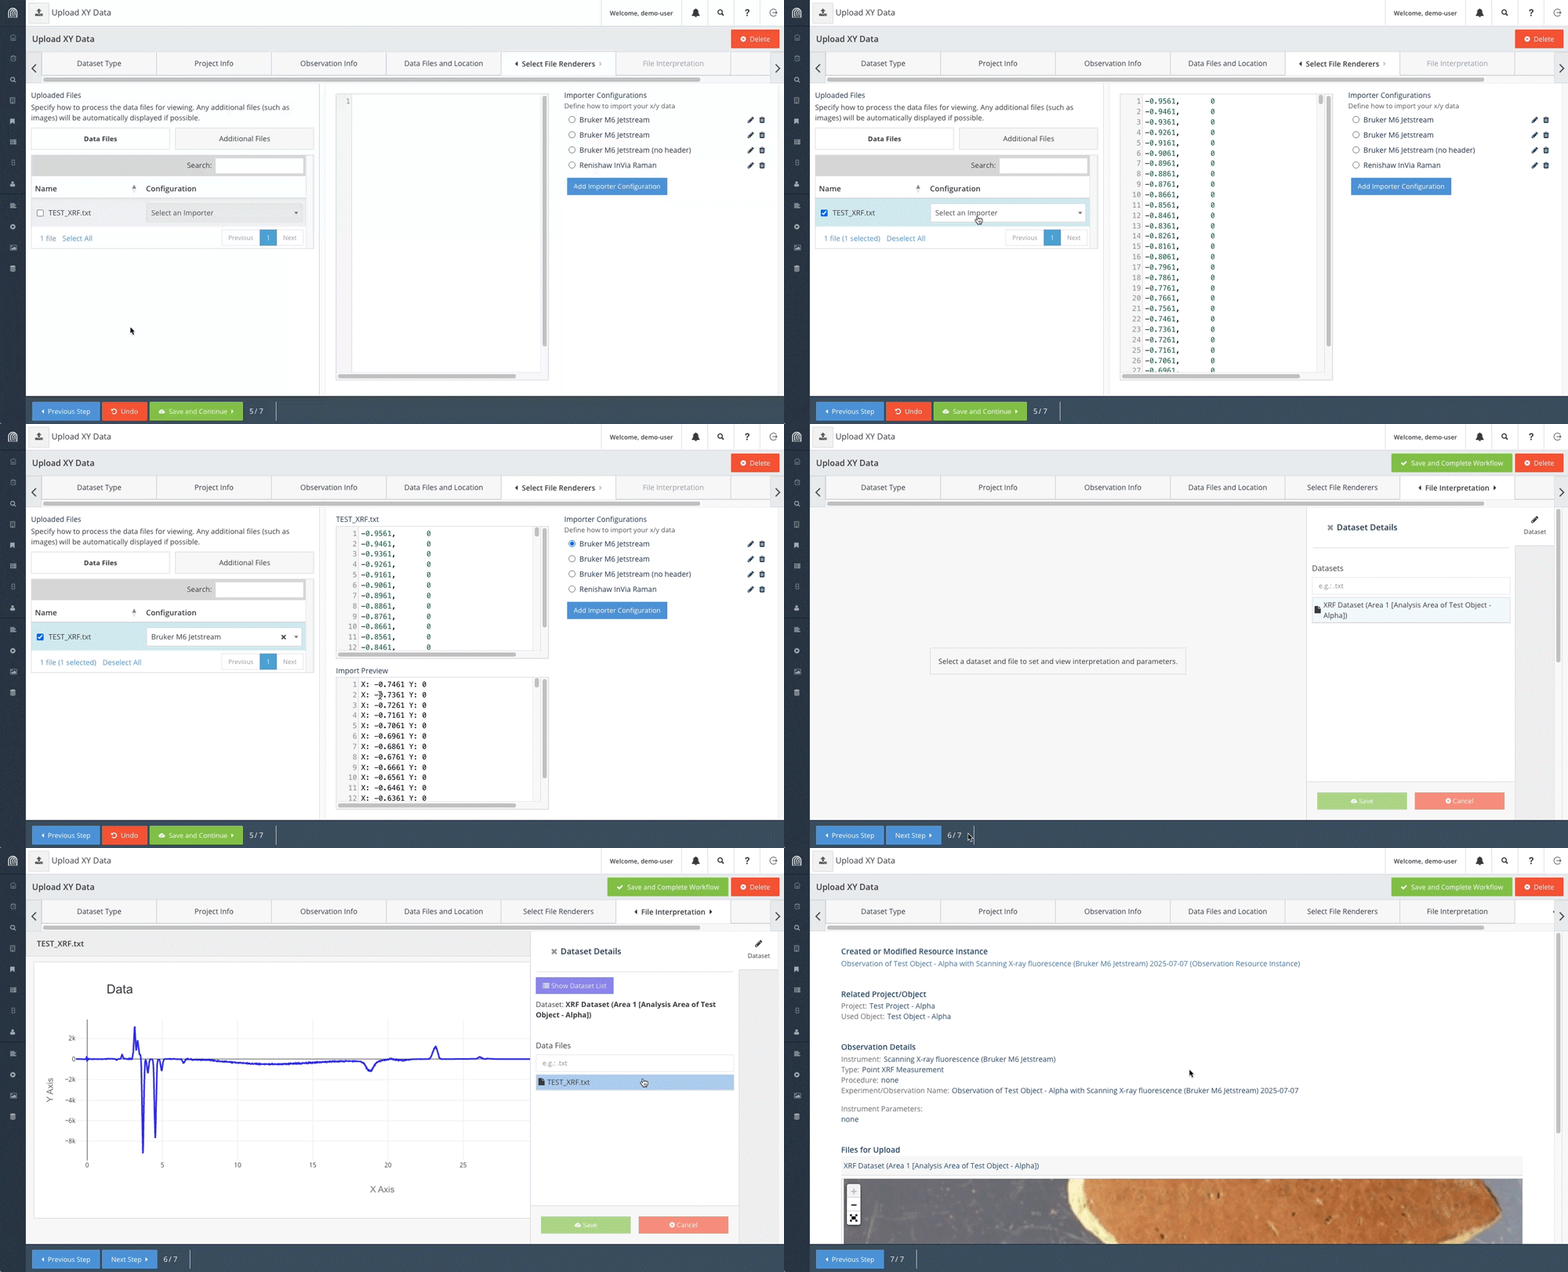
In the next tab Select File Renderers, we can select an importer that will determine how to render the ASCII file into a chart. First, click on the checkbox next to TEST_XRF.txt and under Configuration, select the importer for “Bruker M6 Jetstream”.
The Import Preview will show how the data will be plotted via the X and Y axes. Click Save and Continue.
The File Interpretation tab gives you the opportunity to view the dataset as a chart and add any notes under File Parameters or File Interpretation. Click on the dataset name and select TEST_XRF.txt to view the chart.
Click on Next Step to view the Summary tab and then click on Save and Complete Workflow.
The Review Dataset workflow gives users the opportunity to add data to the File Parameters or File Interpretation fields if that information was not added when the dataset files were uploaded. This tutorial will not cover this workflow, but you are free to try it out and add that data to your dataset.
Manage Projects: Generate a Report
Once data upload/entry has been completed for a Project, key data and information can be inserted into a report template through the Project Report workflow. For this tutorial, we will use a different Project that has more associated data to generate a report.
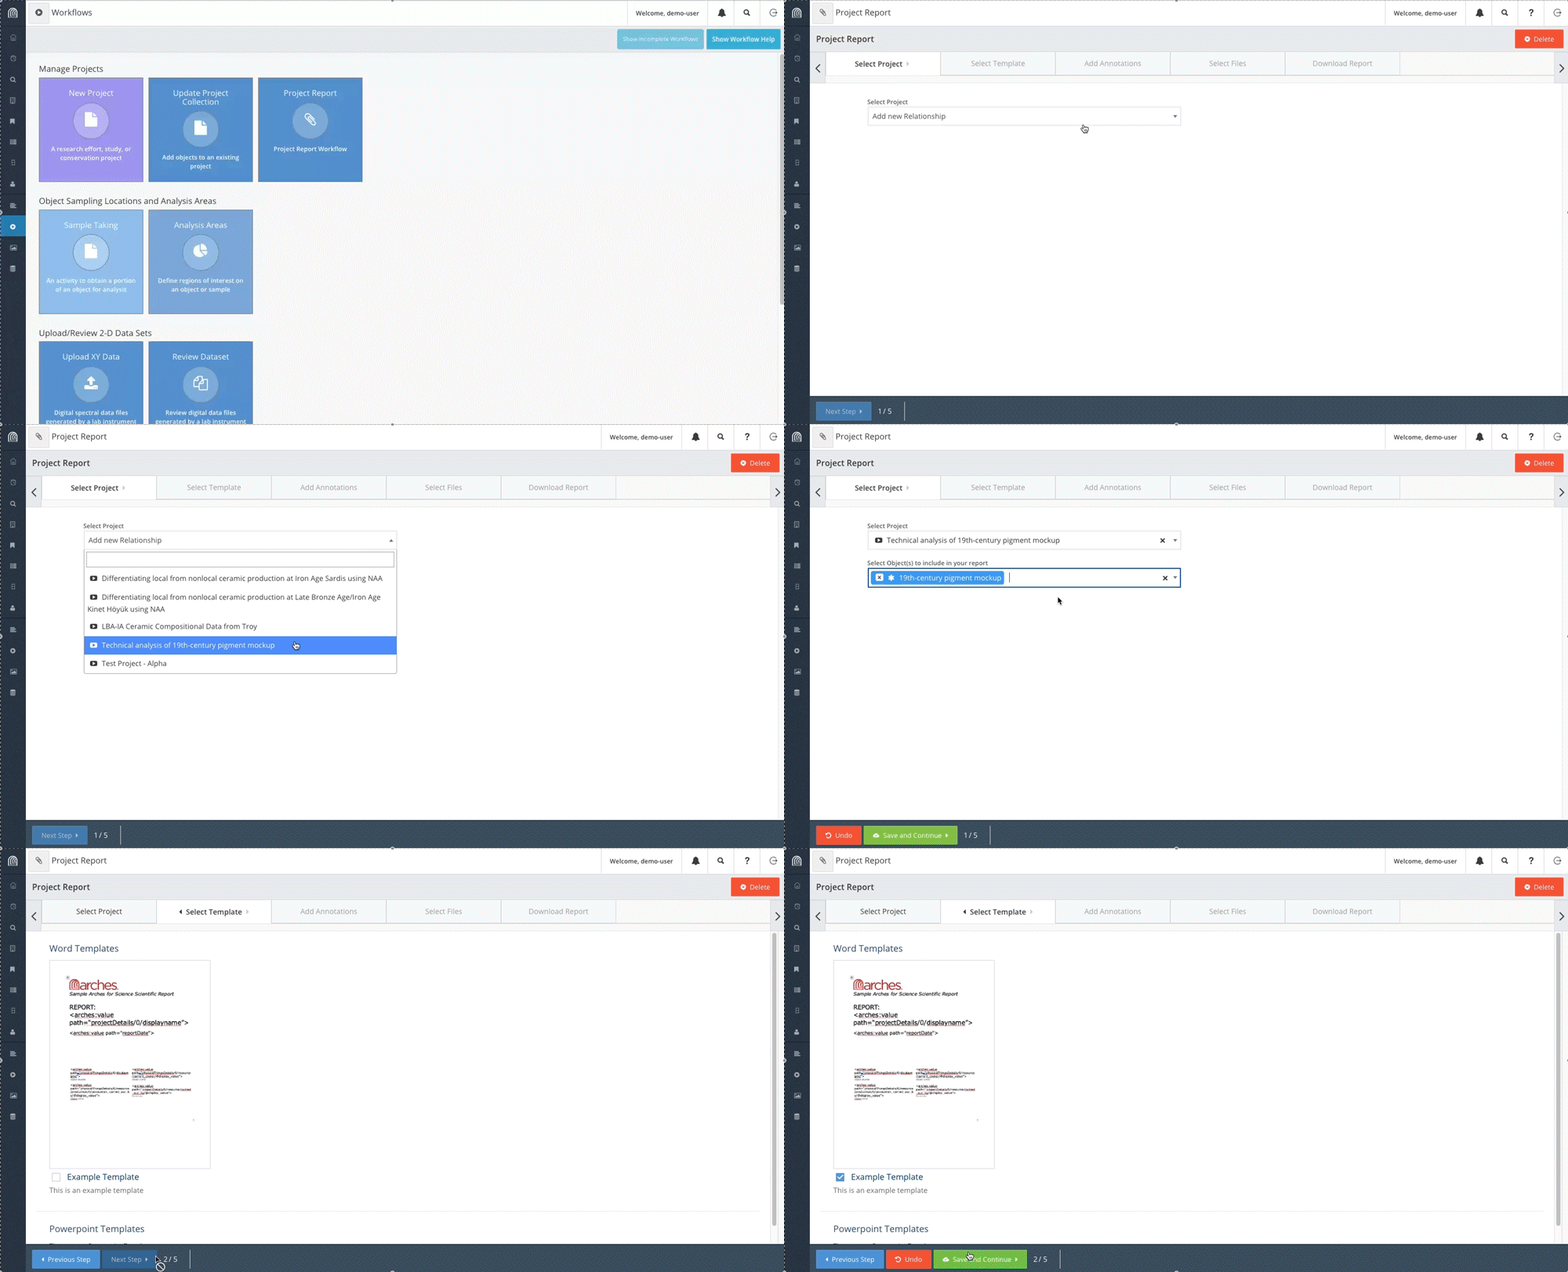
Start by clicking on the Project Report button and selecting the Project “Technical Analysis of 19th-century pigment mockup”. Then select “19th-century pigment mockup” under Select Object(s) to include in your report. Click Save and Continue.
In the Select Template tab, click on the checkbox next to the Example Template and click Save and Continue.
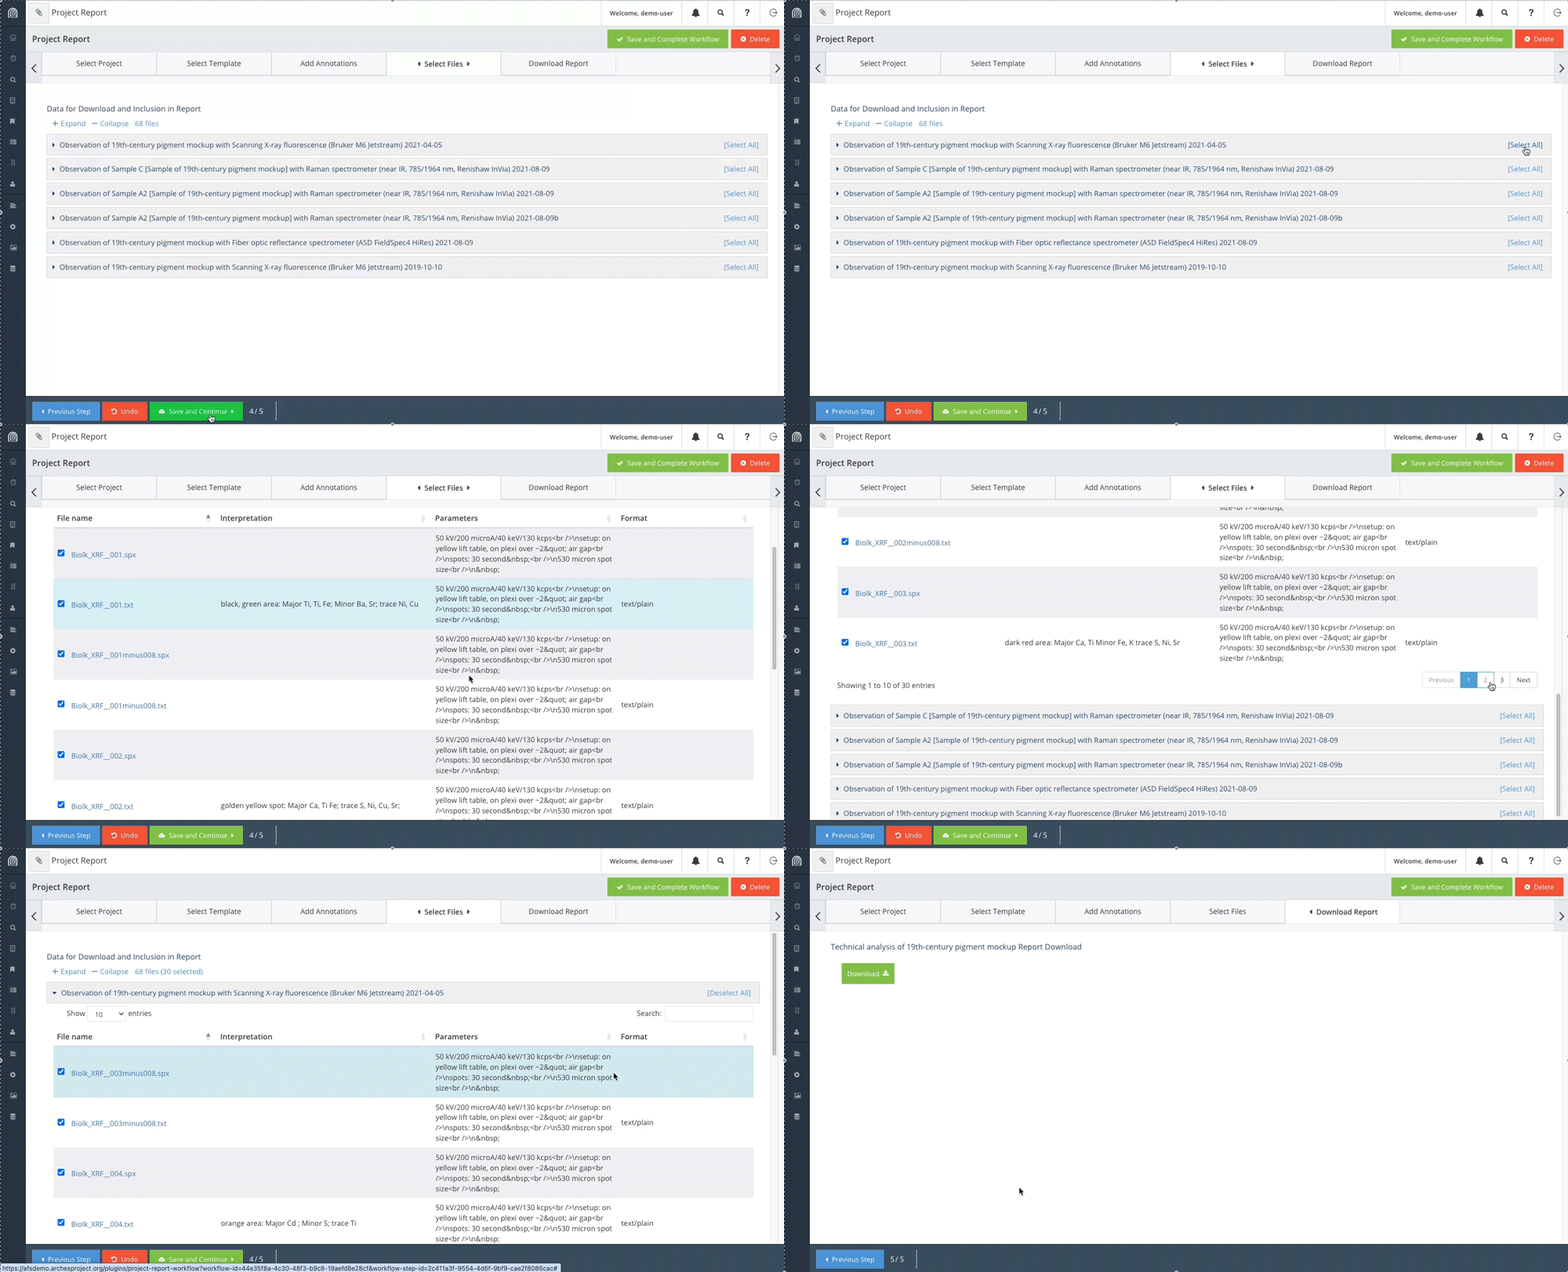
Under the Add Annotations tab, select a canvas and zoom/pan to position it for a screenshot that will be inserted into the report. Click on Grab Screenshot and then Save and Continue.
Under the Select Files tab, choose which data will be downloaded and included in the report. For the purpose of this tutorial, click on [Select All]next to “Observation of 19th-century pigment mockup with Scanning X-ray fluorescence (Bruker M6 Jetstream) 2021-04-04”. After viewing the data, click Save and Continue.
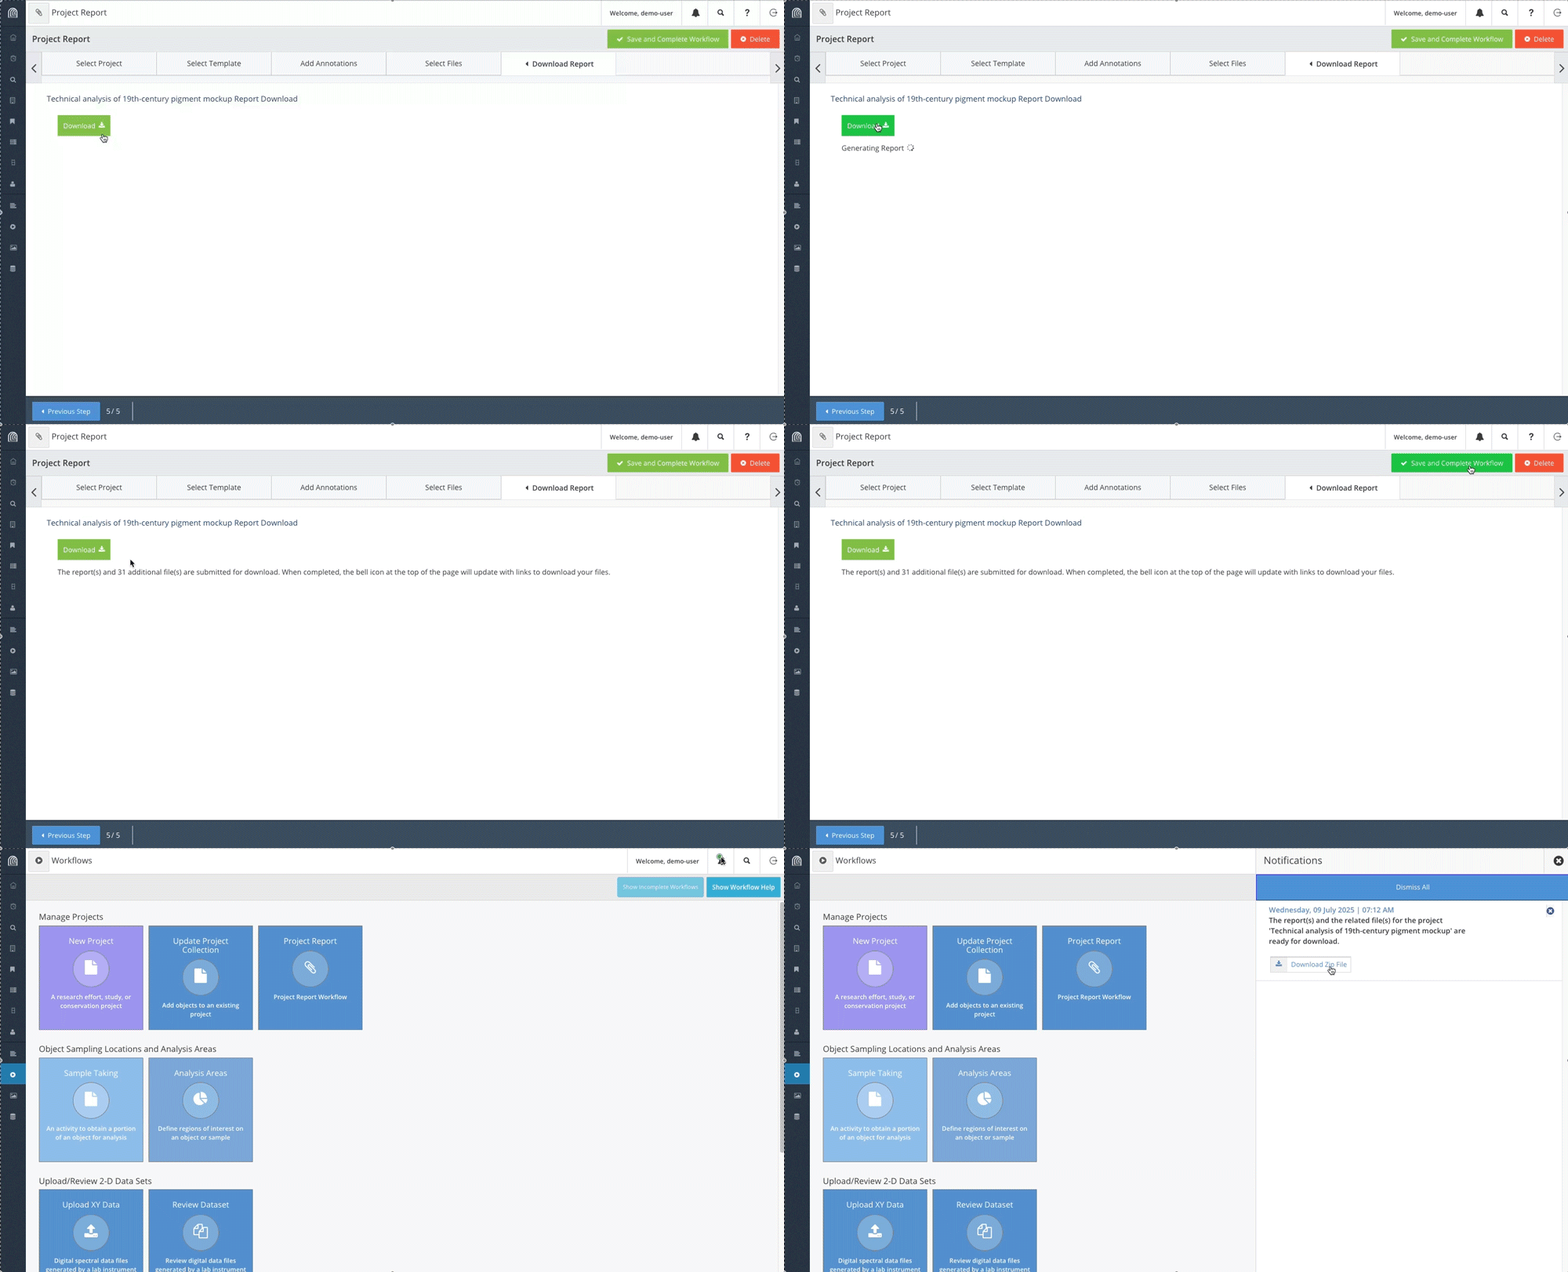
Under the Download Report tab, click the Download button and then Save and Complete Workflow. Click on the bell icon once a notification badge appears and then on Download Zip File. A zip file with the Project Report in Word format and the data files should be saved to your Downloads folder.
This workflow shows how you can bring data from Arches for Science into a Word document template as the starting point for creating a full report. The Project Report Workflow can be further modified to bring in additional templates (including PowerPoint) as well as additional types of data from your Arches for Science instance, all depending on your specific use case.
NOTE: Workflows under Upload 3-D Data Sets and Derivative Products
The workflows under Upload 3-D Data Sets and Derivative Products have been disabled for this demo. The Chemical Analysis Data Upload workflow allows for the upload of large 3-D dataset files and facilitates the capture of data on the instrument used and other observation/data capture details. The Add Chemical Analysis Images workflow enables the upload of images, such as elemental maps, that are to be associated with the 3-D dataset and observation uploaded in the Chemical Analysis Data Upload workflow.
To stay informed about the Arches platform (including any new information regarding this demo), please like our Facebook page, follow us on Twitter, or follow our LinkedIn page. If you have any questions regarding Arches, please visit the Arches Community Forum, where you can search for answers or post new questions.
Last updated: July 2025
